divergence
기호 벡터장의 발산
설명
예제
벡터 에 대해 벡터장 의 발산을 구합니다.
syms x y z
V = [x 2*y^2 3*z^3];
X = [x y z];
div = divergence(V,X)
div =
벡터장의 회전의 발산이 0임을 봅니다.
divCurl = divergence(curl(V,X),X)
divCurl =
스칼라 필드 의 기울기의 발산을 구합니다. 결과는 스칼라 필드의 라플라시안입니다.
syms x y z
f = x^2 + y^2 + z^2;
divGrad = divergence(gradient(f,X),X)
divGrad =
가우스 법칙의 미분 형태는 전기장의 발산이 전하 밀도에 비례한다고 설명합니다.
전기장 의 전하 밀도를 구합니다.
syms x y ep0
E = [x^2 y^2];
rho = divergence(E,[x y])*ep0
rho =
ep0 = 1을 사용하여 와 에 대해 전기장과 전하 밀도를 시각화합니다. meshgrid를 사용하여 x 값과 y 값의 그리드를 만듭니다. subs를 사용해 그리드 값을 대입하여 전기장과 전하 밀도의 값을 구합니다. subs에 대한 입력값으로 셀형 배열을 사용하여 전하 밀도 rho에 그리드 값 xPlot과 yPlot을 동시에 대입합니다.
rho = subs(rho,ep0,1);
v = -2:0.1:2;
[xPlot,yPlot] = meshgrid(v);
Ex = subs(E(1),x,xPlot);
Ey = subs(E(2),y,yPlot);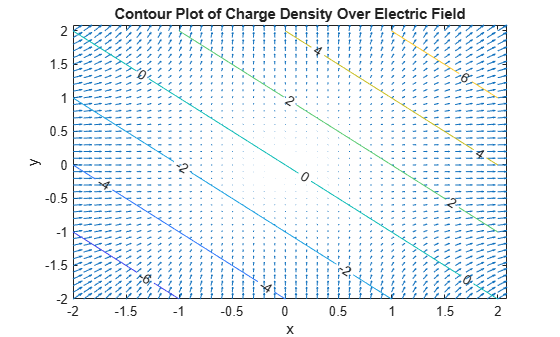
rhoPlot = double(subs(rho,{x,y},{xPlot,yPlot}));quiver를 사용하여 전기장을 플로팅합니다. contour를 사용하여 전하 밀도를 겹쳐 놓습니다. 등고선이 전하 밀도의 값을 나타냅니다.
quiver(xPlot,yPlot,Ex,Ey)
hold on
contour(xPlot,yPlot,rhoPlot,"ShowText","on")
title("Contour Plot of Charge Density Over Electric Field")
xlabel("x")
ylabel("y")
R2023a 이후
맥스웰 방정식으로부터 전하와 전류원이 없는 자유 공간에서의 전자기 파동 방정식을 도출합니다.
우선, 진공 투자율과 유전율을 나타내는 기호 스칼라 변수를 만듭니다. 카테시안 좌표를 나타내는 기호 행렬 변수를 만듭니다. 전기장과 자기장을 공간과 시간의 함수로 나타내는 두 개의 기호 행렬 함수를 만듭니다.
syms mu_0 epsilon_0
syms X [3 1] matrix
syms E(X,t) B(X,t) [3 1] matrix keepargs
다음으로 맥스웰 방정식을 나타내는 네 개의 방정식을 만듭니다.
Maxwell1 = divergence(E,X) == 0
Maxwell1(X, t) =
Maxwell2 = curl(E,X) == -diff(B,t)
Maxwell2(X, t) =
Maxwell3 = divergence(B,X) == 0
Maxwell3(X, t) =
Maxwell4 = curl(B,X) == mu_0*epsilon_0*diff(E,t)
Maxwell4(X, t) =
그런 다음 전기장의 파동 방정식을 구합니다. 두 번째 맥스웰 방정식의 회전을 계산합니다.
wave_E = curl(Maxwell2,X)
wave_E(X, t) =
전기장 파동 방정식에 첫 번째 맥스웰 방정식을 대입합니다. lhs와 rhs를 사용하여 첫 번째 맥스웰 방정식의 좌변과 우변을 구합니다.
wave_E = subs(wave_E,lhs(Maxwell1),rhs(Maxwell1))
wave_E(X, t) =
네 번째 맥스웰 방정식의 시간 도함수를 계산합니다.
dMaxwell4 = diff(Maxwell4,t)
dMaxwell4(X, t) =
wave_E에서 자기장 를 포함하는 항을 dMaxwell4의 우변에 대입합니다. lhs와 rhs를 사용하여 dMaxwell4로부터 이러한 항을 구합니다.
wave_E = subs(wave_E,lhs(dMaxwell4),rhs(dMaxwell4))
wave_E(X, t) =
비슷한 단계를 사용하여 자기장의 파동 방정식을 구할 수도 있습니다.
wave_B = curl(Maxwell4,X)
wave_B(X, t) =
wave_B = subs(wave_B,lhs(Maxwell3),rhs(Maxwell3))
wave_B(X, t) =
dMaxwell2 = diff(Maxwell2,t)
dMaxwell2(X, t) =
wave_B = subs(wave_B,lhs(dMaxwell2),rhs(dMaxwell2))
wave_B(X, t) =
입력 인수
제한 사항
divergence함수는 텐서 도함수를 지원하지 않습니다. 입력값V가 벡터가 아닌 텐서 필드 또는 행렬인 경우divergence함수는 오류를 반환합니다.Symbolic Math Toolbox™는 유형
symmatrix의 기호 행렬 변수와symfunmatrix의 기호 행렬 함수에 대해dot함수 또는cross함수를 현재 지원하지 않습니다. 벡터 미적분 항등식이 내적 또는 외적을 포함하는 경우 툴박스는 해당 항등식을 지원되는 다른 함수로 대신 표시합니다. 기호 행렬 변수와 기호 행렬 함수를 지원하는 모든 함수의 목록을 보려면 명령methods symmatrix와methods symfunmatrix를 사용하십시오.