Time-Frequency Analysis
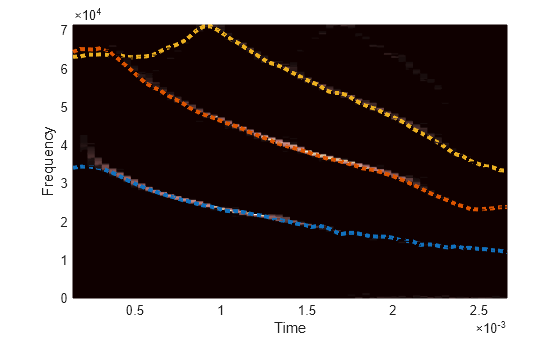
Signal Processing Toolbox™ provides functions and apps that enable you to visualize and compare time-frequency content of nonstationary signals. Compute the short-time Fourier transform and its inverse. Obtain sharp spectral estimates using reassignment or Fourier synchrosqueezing. Plot cross-spectrograms, Wigner-Ville distributions, and persistence spectra. Extract and track time-frequency ridges. Estimate instantaneous frequency, instantaneous bandwidth, spectral kurtosis, and spectral entropy. Perform data-adaptive time-frequency analysis using empirical or variational mode decomposition and the Hilbert-Huang transform. Explore other time-frequency representations and analysis methods using the functions and apps provided by Wavelet Toolbox™.
Apps
| Signal Analyzer | Visualize and compare multiple signals and spectra |
| Signal Labeler | Label signal attributes, regions, and points of interest |
| Signal Multiresolution Analyzer | Decompose signals into time-aligned components |
| Wavelet Time-Frequency Analyzer | Visualize scalogram of signals (Since R2022a) |
Functions
Topics
- Spectrogram Computation with Signal Processing Toolbox
Compute and display spectrograms of signals using Signal Processing Toolbox functions.
- Time-Frequency Gallery
Examine the features and limitations of the time-frequency analysis functions provided by Signal Processing Toolbox.
- Practical Introduction to Time-Frequency Analysis Using the Continuous Wavelet Transform (Wavelet Toolbox)
Perform and interpret time-frequency analysis of signals using the continuous wavelet transform.
- Practical Introduction to Multiresolution Analysis (Wavelet Toolbox)
Perform and interpret basic signal multiresolution analysis (MRA).
- Wavelet Packet Harmonic Interference Removal (Wavelet Toolbox)
Use wavelet packets to remove harmonic interference from an electrocardiogram (ECG) signal. (Since R2021b)
- Pedestrian and Bicyclist Classification Using Deep Learning (Radar Toolbox)
Classify pedestrians and bicyclists based on their micro-Doppler characteristics using deep learning and time-frequency analysis. (Since R2021a)
- Radar and Communications Waveform Classification Using Deep Learning (Phased Array System Toolbox)
Classify radar and communications waveforms using the Wigner-Ville distribution (WVD) and a deep convolutional neural network (CNN).
- Spectral Descriptors (Audio Toolbox)
Overview and applications of spectral descriptors.
Related Information
- Time-Frequency Analysis (Wavelet Toolbox)


