Main Content

closestPointsToSequence

Projects sequence of points onto path

Since R2022a

    Description

    pathPoints = closestPointsToSequence(refPath,points,initWindow) uses the closest point within a sequence of points, points, to be within the valid search window, initWindow. For each point in Points, the search window is centered at the previous point.

    [pathPoints,inWindow] = closestPointsToSequence(refPath,points,initWindow) optionally returns a logical vector inWindow, specifying whether each point for the corresponding xy coordinate in points is projected within the search window.

    example

    Examples

    collapse all

    [refPath,generator,f0,f1] = closestPointExampleSetup;

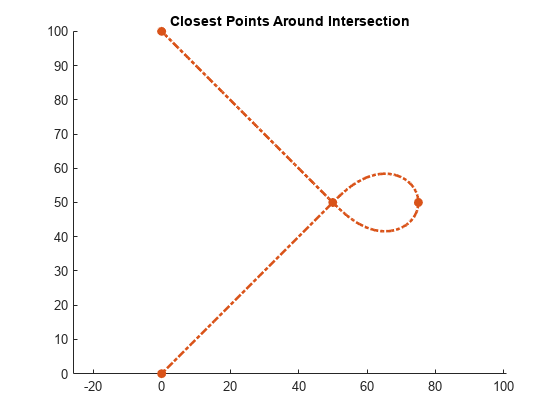
    Figure contains an axes object. The axes object with title Closest Points Around Intersection contains 2 objects of type line. One or more of the lines displays its values using only markers

    Define the plot helper functions.

    mergeFcn = @(v1,v2)reshape([v1 v2 nan(size(v1,1),size(v2,2))]',[],1);
    plotFcn = @(L1,L2,linespec)plot(mergeFcn(L1(:,1),L2(:,1:min(1,size(L2,2)))), ...
       mergeFcn(L1(:,2),L2(:,2:min(2,size(L2,2)))),linespec{:});
    plotInterval = @(bounds,nPt,linespec)plotFcn(interpolate(...
        refPath,linspace(bounds(1),bounds(2),nPt)'),[],linespec);

    Generate a trajectory which itself contains an intersection.

    f2 = f1;
    f2(1) = refPath.SegmentParameters(4,end) + 20;

    Set the states such that it starts from rest and terminates with a positive velocity and no acceleration.

    f0(2) = 0;                          % Initial lon. speed set to 0
    f2(2) = 5;                          % Terminal lon. speed set to 5
    deltaS = (f2(1)-f0(1));             % Longitudinal distance traveled
    vAvgEstimate = (f2(2)-f0(2))/2;     % Rough average lon. velocity estimate
    T2 = deltaS/vAvgEstimate;           % Ballpark travel duration

    Generate the trajectory.

    [fIntersecting,gIntersecting] = connect(generator,f0,f2,T2);
    gXingPts = gIntersecting.Trajectory;

    Plot the trajectory.

    figure
    show(refPath); 
    xlim([0 125])
    ylim([0 125])
    hold on

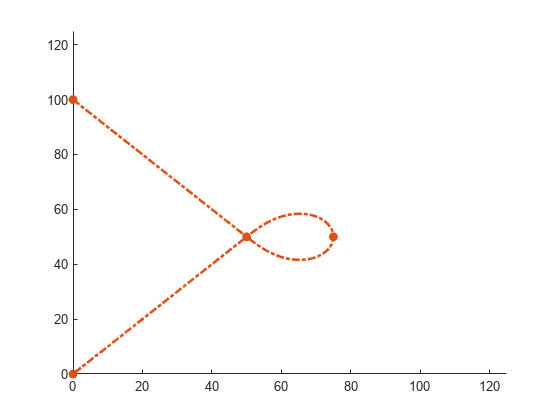
    Figure contains an axes object. The axes object contains 2 objects of type line. One or more of the lines displays its values using only markers

    Find the closest points across trajectory.

    closestPts = closestPoint(refPath,gXingPts);

    Find closest points in window that spans the full trajectory length.

    windowBuffer = 5;
    fXingPts = fIntersecting.Trajectory;
    fixedWindow = [min(fXingPts(:,1))-windowBuffer max(fXingPts(:,1))+windowBuffer];
    closestPtsFullWindow = closestPoint(refPath,gXingPts,fixedWindow);

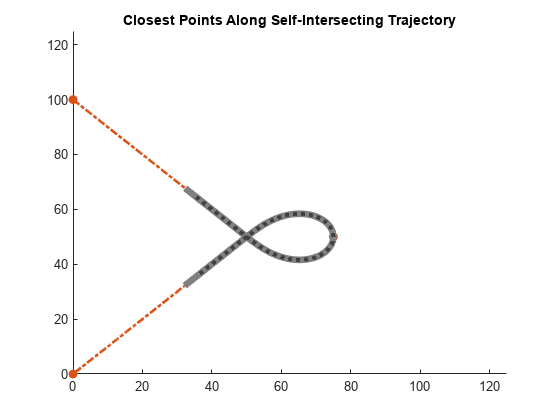
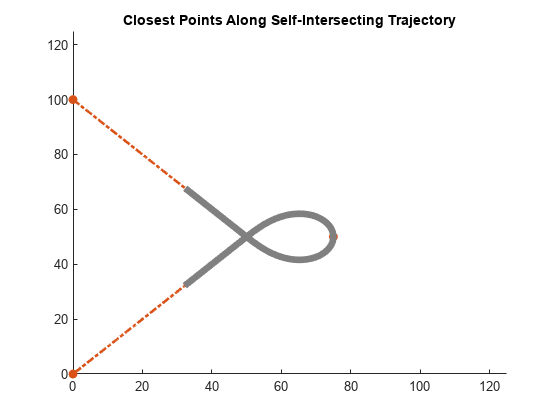
    Plot the naive closest-points here.

    title("Closest Points Along Self-Intersecting Trajectory")
    plotInterval(fixedWindow,100,{"Color",[.5 .5 .5],"LineWidth",5});

    Figure contains an axes object. The axes object with title Closest Points Along Self-Intersecting Trajectory contains 3 objects of type line. One or more of the lines displays its values using only markers

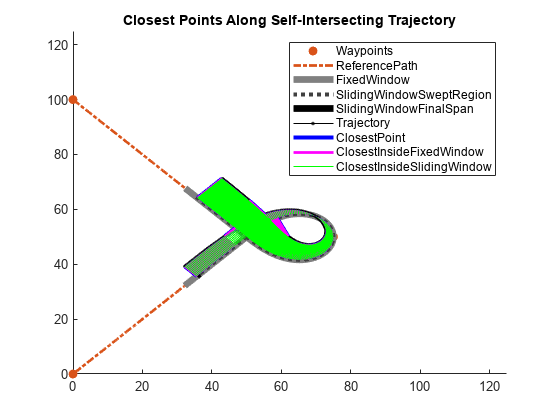
    Calculate a sliding window size based on the max global velocity. Note that this may not cover the trajectory depending on the shape of the reference path.

    dsApprox = max(abs(gXingPts(:,5)))*generator.TimeResolution;
    initialWindow = fXingPts(1)+[-1 1]*dsApprox;
    [closestPtsSlidingWindow, inWindow] = closestPointsToSequence(refPath,gXingPts,initialWindow);

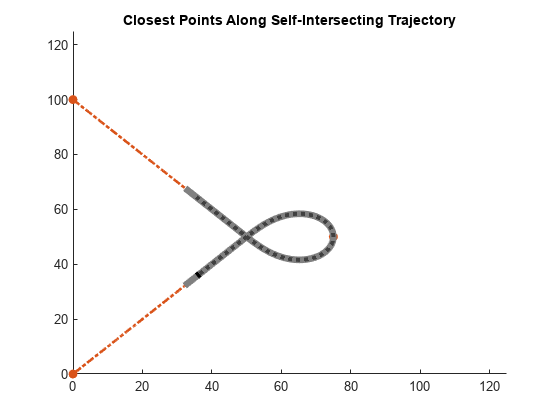
    Calculate the region swept by the sliding window. Then plot the swept region.

    sweptRegion = [closestPtsSlidingWindow(1,end)-dsApprox,closestPtsSlidingWindow(end-1,end)+dsApprox];
    plotInterval(sweptRegion,100,{":","Color",[.25 .25 .25],"LineWidth",3});

    Figure contains an axes object. The axes object with title Closest Points Along Self-Intersecting Trajectory contains 4 objects of type line. One or more of the lines displays its values using only markers

    finalWindow = [closestPtsSlidingWindow(end-1,end)-dsApprox,closestPtsSlidingWindow(end-1,end)+dsApprox];
    plotInterval(finalWindow,100,{"k","LineWidth",5});

    Figure contains an axes object. The axes object with title Closest Points Along Self-Intersecting Trajectory contains 5 objects of type line. One or more of the lines displays its values using only markers

    Display results.

    plotFcn(gXingPts,[],{"k.-"});
    plotFcn(gXingPts,closestPts,{"b","LineWidth",3});
    plotFcn(gXingPts,closestPtsFullWindow,{"m","LineWidth",2})
    plotFcn(gXingPts(inWindow,:),closestPtsSlidingWindow(inWindow,:),{"g"});
    plotFcn(gXingPts(~inWindow,:),closestPtsSlidingWindow(~inWindow,:),{"r"});
    legend({"Waypoints","ReferencePath","FixedWindow", ...
        "SlidingWindowSweptRegion","SlidingWindowFinalSpan", ...
        "Trajectory", "ClosestPoint","ClosestInsideFixedWindow", ...
        "ClosestInsideSlidingWindow"});

    Figure contains an axes object. The axes object with title Closest Points Along Self-Intersecting Trajectory contains 9 objects of type line. One or more of the lines displays its values using only markers These objects represent Waypoints, ReferencePath, FixedWindow, SlidingWindowSweptRegion, SlidingWindowFinalSpan, Trajectory, ClosestPoint, ClosestInsideFixedWindow, ClosestInsideSlidingWindow.

    Input Arguments

    collapse all

    Reference path, specified as a referencePathFrenet object.

    Global points, specified as a P-by-2 numeric matrix with rows of the form [x y]. P is the number of points. Positions are in meters.

    Initial search window, specified as a two-element row vector in the form [minimum_bound maximum_bound].

    Output Arguments

    collapse all

    Closest points on the reference path , returned as an N-by-6 numeric matrix with rows of form [x y theta kappa dkappa s], where:

    • x y and theta — SE(2) state expressed in global coordinates, with x and y in meters and theta in radians

    • kappa — Curvature, or inverse of the radius, in m-1

    • dkappa — Derivative of curvature with respect to arc length in m-2

    • s — Arc length, or distance along path from path origin, in meters

    N is the number of points sampled along the reference path.

    Indication whether each point nearest to the corresponding xy coordinate in points, is projected within the search window, returned as an N-element logical column vector, where N is the number of points in points. Points being projected within the search window are true, or false if they lie at the end of a window.

    Extended Capabilities

    C/C++ Code Generation
    Generate C and C++ code using MATLAB® Coder™.

    Version History

    Introduced in R2022a
    Go to top of page