Main Content

closestProjections

Find orthogonal projections between path tangent vector and query point

Since R2022a

    Description

    [arclengths,distances] = closestProjections(refPath,points) attempts to project each xy point in the points matrix, onto each clothoid segment contained in the reference path, refPath, such that the projection vector is orthogonal to the path tangent-angle. Returns closest orthogonal projection between the curve and query point in each segment as a pair of two cell arrays, arclengths and distances containing the arclengths and distances respectively.

    [___,projPoints] = closestProjections(refPath,points) optionally returns the projected points, projPoints as a cell array containing path data evaluated at the corresponding arclengths element.

    example

    [___] = closestProjections(refPath,points,bestN) returns the nearest projections, bestNfor each xy point in points.

    [___] = closestProjections(refPath,points,intervals) accepts an optional matrix of arclengths intervals, intervals, where each row contains a lower and upper arclength bounds.

    [___] = closestProjections(refPath,points,intervals,bestN) returns up to the nearest projections bestN for each xy point in points.

    Examples

    collapse all

    Create a reference path with multiple intersections.

    leftSideAngles  = [linspace(-pi/6,pi/6,4) linspace(pi/6,-pi/6,4)]';
    rightSideAngles = [linspace(-pi/6,pi/6,4) linspace(-pi/6,pi/6,4)]';
    waypoints = zeros(numel(leftSideAngles)*2,3);
    width = 10;
    height = 20;
    waypoints(1:2:end,:) = [zeros(numel(leftSideAngles),1) linspace(0,height,numel(leftSideAngles))' leftSideAngles]; ...
                            waypoints(2:2:end,:) = [width*ones(numel(leftSideAngles),1) linspace(0,height,numel(leftSideAngles))' rightSideAngles];
    refPath = referencePathFrenet(waypoints);

    Create a set of random XY points around the path.

    queryPoints = [width height]/2+(rand(10,2)-.5).*[width height]*1.5;

    Retrieve the nearest valid projection of each query point on each segment in the path.

    [allArclenth,allDistance,allProjection] = closestProjections(refPath,queryPoints);
    pLength = refPath.PathLength;
    breaks = [refPath.SegmentParameters(:,end); pLength];
    allInterval = [breaks(1:end) [breaks(2:end); pLength]];

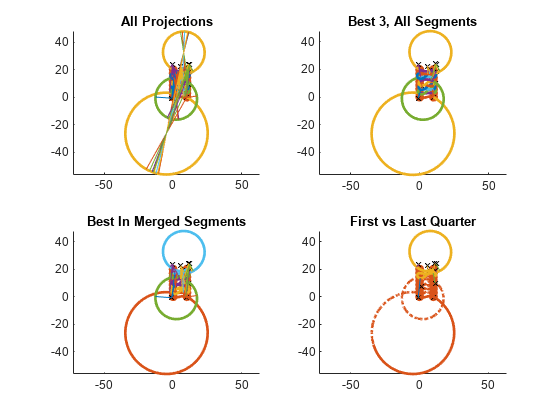
    Return the three best projections.

    maxResult = 3;
    [best3Arclength,best3Distance,best3Projection] = closestProjections(refPath,queryPoints,maxResult);

    Define a custom set of arclength-intervals.

    everyThreeMerged = [breaks(1:3:end-1) [breaks(4:3:end-1); breaks(end)]];

    Find the best projection of each query-point onto each custom interval that exists.

    [allArclengthCustom,allDistanceCustom,allProjectionCustom] = closestProjections(refPath,queryPoints,everyThreeMerged);

    Return the single best projection in the first and last quarter of the path.

    endQuarterIntervals = [0 1/4; 3/4 1]*refPath.PathLength;
    [bestQuarterArclength,bestQuarterDistance,bestQuarterProjection] = closestProjections(refPath,queryPoints,endQuarterIntervals, 1);

    Display the results.

    % Pack iterable containers
    intervalSets = {allInterval, allInterval, everyThreeMerged, endQuarterIntervals};
    S = {allArclenth best3Arclength allArclengthCustom bestQuarterArclength};
    D = {allDistance best3Distance allDistanceCustom bestQuarterDistance};
    PP = {allProjection best3Projection allProjectionCustom bestQuarterProjection};
    titles = ["All Projections","Best 3, All Segments","Best In Merged Segments","First vs Last Quarter"];
    cOrder = colororder;

    Define the helper functions.

    mergeFcn = @(v1,v2)reshape([v1 v2 nan(size(v1,1),size(v2,2))]',[],1);
    plotFcn = @(L1,L2,linespec)plot(mergeFcn(L1(:,1),L2(:,1:min(1,size(L2,2)))),mergeFcn(L1(:,2),L2(:,2:min(2,size(L2,2)))),linespec{:});
    intervalPlotter = @(bounds,nPt,linespec)plotFcn(interpolate(refPath,linspace(bounds(1),bounds(2),nPt)'),[],linespec);

    Create in-loop handles.

    setupFcns = {};
    setupFcns{1} = @(figIdx)hold(show(refPath,"Parent",subplot(2,2,figIdx)),"on"); 
    setupFcns{2} = @(figIdx)axis(subplot(2,2,figIdx),"equal");
    setupFcns{3} = @(figIdx)title(subplot(2,2,figIdx),titles(figIdx));
    setupFcns{4} = @(figIdx)plotFcn(queryPoints,[],{"Xk","MarkerSize",5});
    setupFcns{5} = @(figIdx)arrayfun(@(i)intervalPlotter(intervalSets{figIdx}(i,:),100,{"Color",cOrder(mod(i,size(cOrder,1)-1)+1,:),"LineWidth",2'}),1:size(intervalSets{figIdx},1));
    setupFcns{6} = @(figIdx)cellfun(@(p,projPts)plotFcn(repmat(queryPoints(p,:),size(projPts,1),1),projPts,{"Color",cOrder(mod(p,size(cOrder,1)-1)+1,:)}),num2cell(1:size(queryPoints,1))',PP{figIdx});

    Display the results.

    arrayfun(@(idx)cellfun(@(f)f(idx),setupFcns),1:4)

    Figure contains 4 axes objects. Axes object 1 with title All Projections contains 29 objects of type line. One or more of the lines displays its values using only markers Axes object 2 with title Best 3, All Segments contains 29 objects of type line. One or more of the lines displays its values using only markers Axes object 3 with title Best In Merged Segments contains 18 objects of type line. One or more of the lines displays its values using only markers Axes object 4 with title First vs Last Quarter contains 15 objects of type line. One or more of the lines displays its values using only markers

    Input Arguments

    collapse all

    Reference path, specified as a referencePathFrenet object.

    Global points, specified as a P-by-2 numeric matrix with rows of the form [x y]. P is the number of points. Positions are in meters.

    Best N projections, specified as a scalar in the range [1,N], where N is the number of segments in the path.

    Arclength intervals, specified as a N-by-2 matrix, where each row is of the form [minimum_arclength, maximum_arclength] in meters, and N is the number of segments in the path.

    Output Arguments

    collapse all

    Arclengths between curve and query points, returned as an M-element cell array, where M is the number of query points in the points input. Each cell contains a P-element column vector, where P is in the range [0,N] and N is the number of segments in the path.

    Distances between curve and query points, returned as an M-element cell array, where M is the number of query points in the points input. Each cell contains a P-element column vector, where P is in the range [0,N] and N is the number of segments in the path.

    Projected points, returned as an M-element cell array, where M is the number of query points in the points input. Each cell contains a P-by-6 matrix, where P is in the range [0,N] and each row is in the form [x y theta k dk s]. x, y, theta, k, dk, s, are the x and y positions, tangent angle, curvature, change in curvature, at the arclength, s, respectively.

    Extended Capabilities

    C/C++ Code Generation
    Generate C and C++ code using MATLAB® Coder™.

    Version History

    Introduced in R2022a

    Go to top of page