다음에 대한 결과:
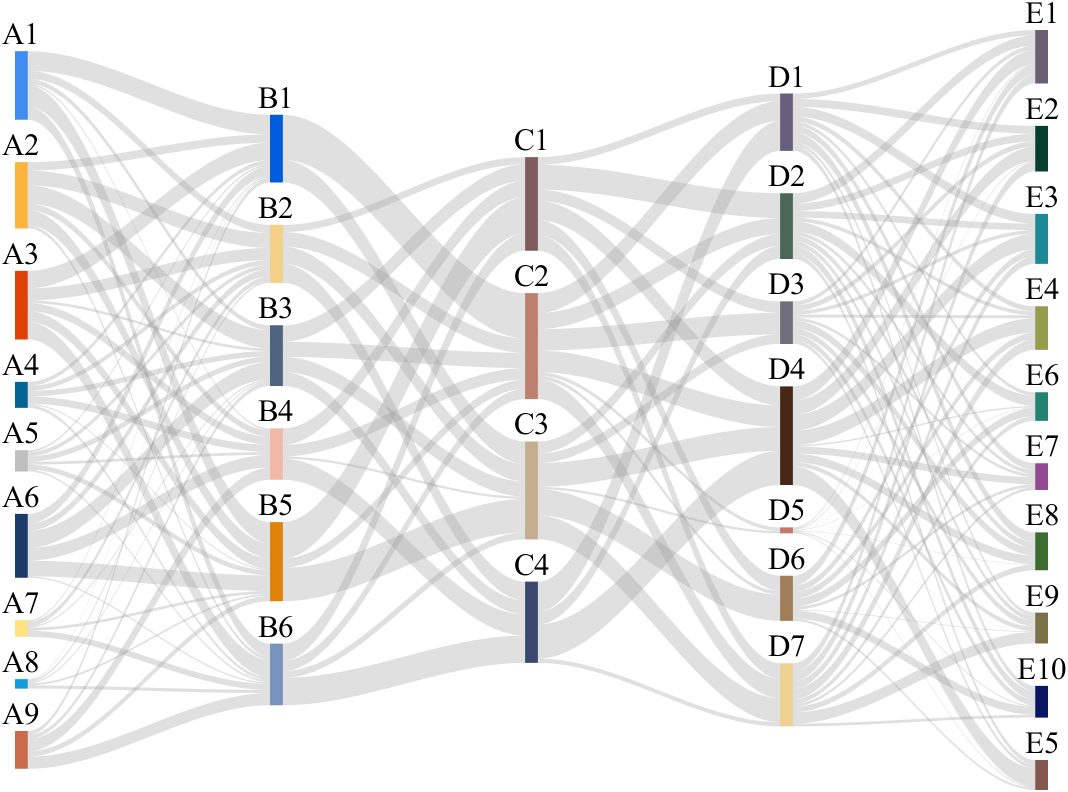
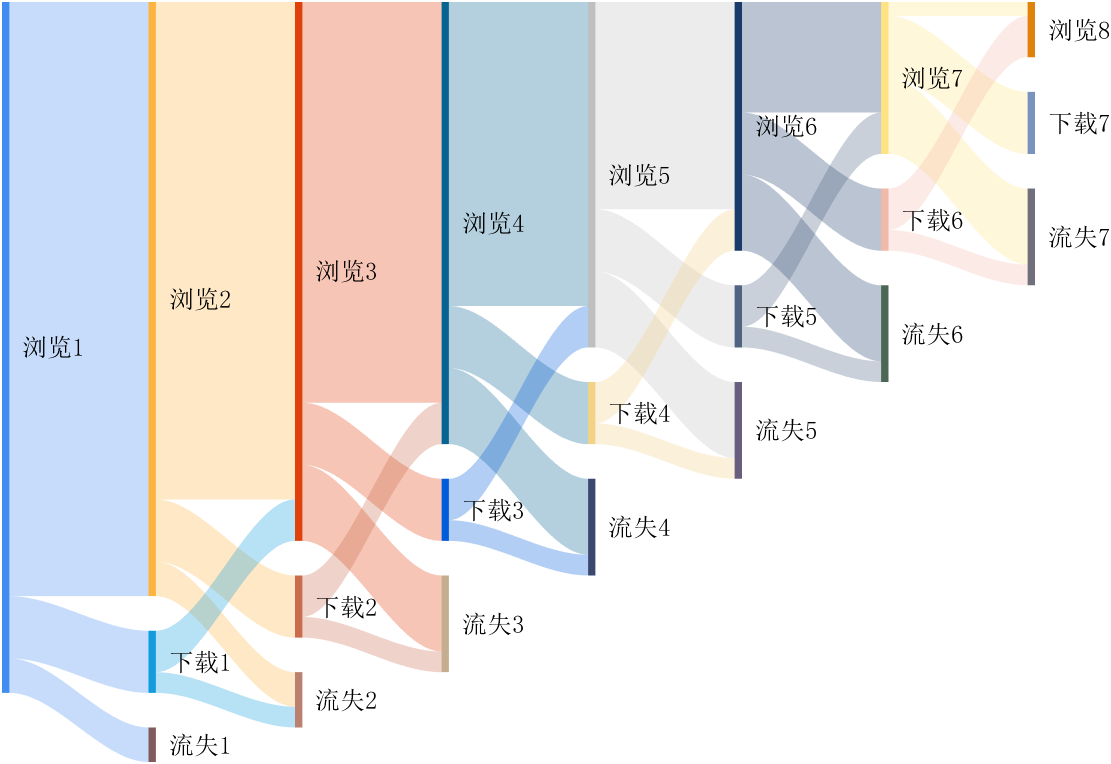
This is a brief introduction and recommendation of a Sankey diagram plotting tool:
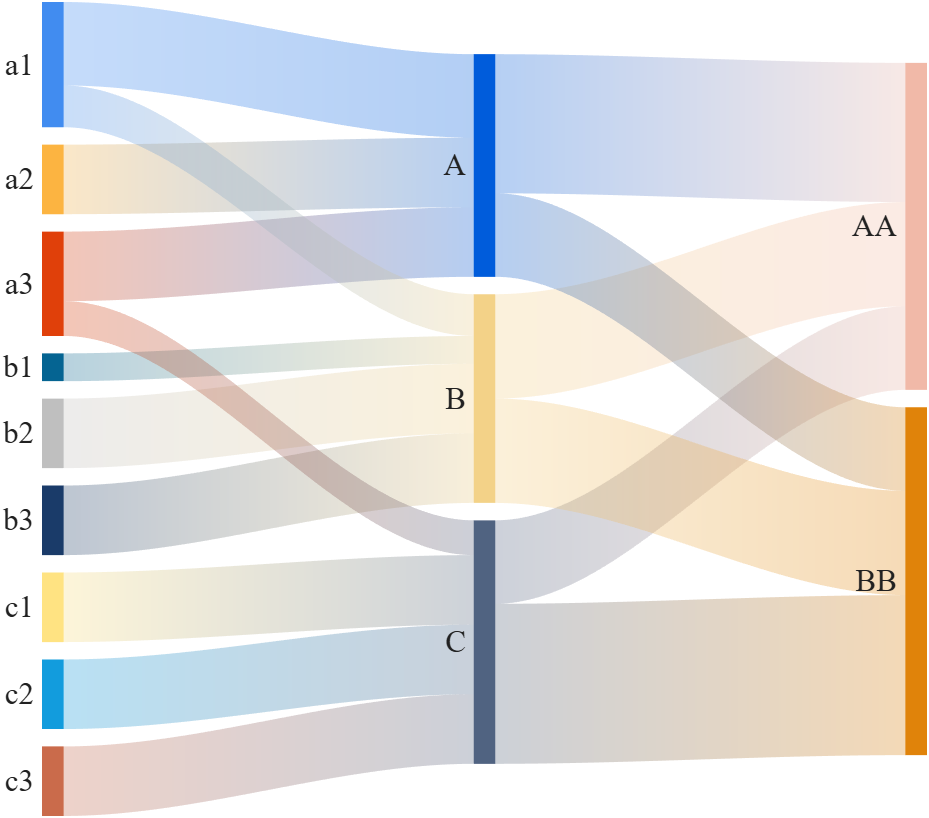
Basic usage - links
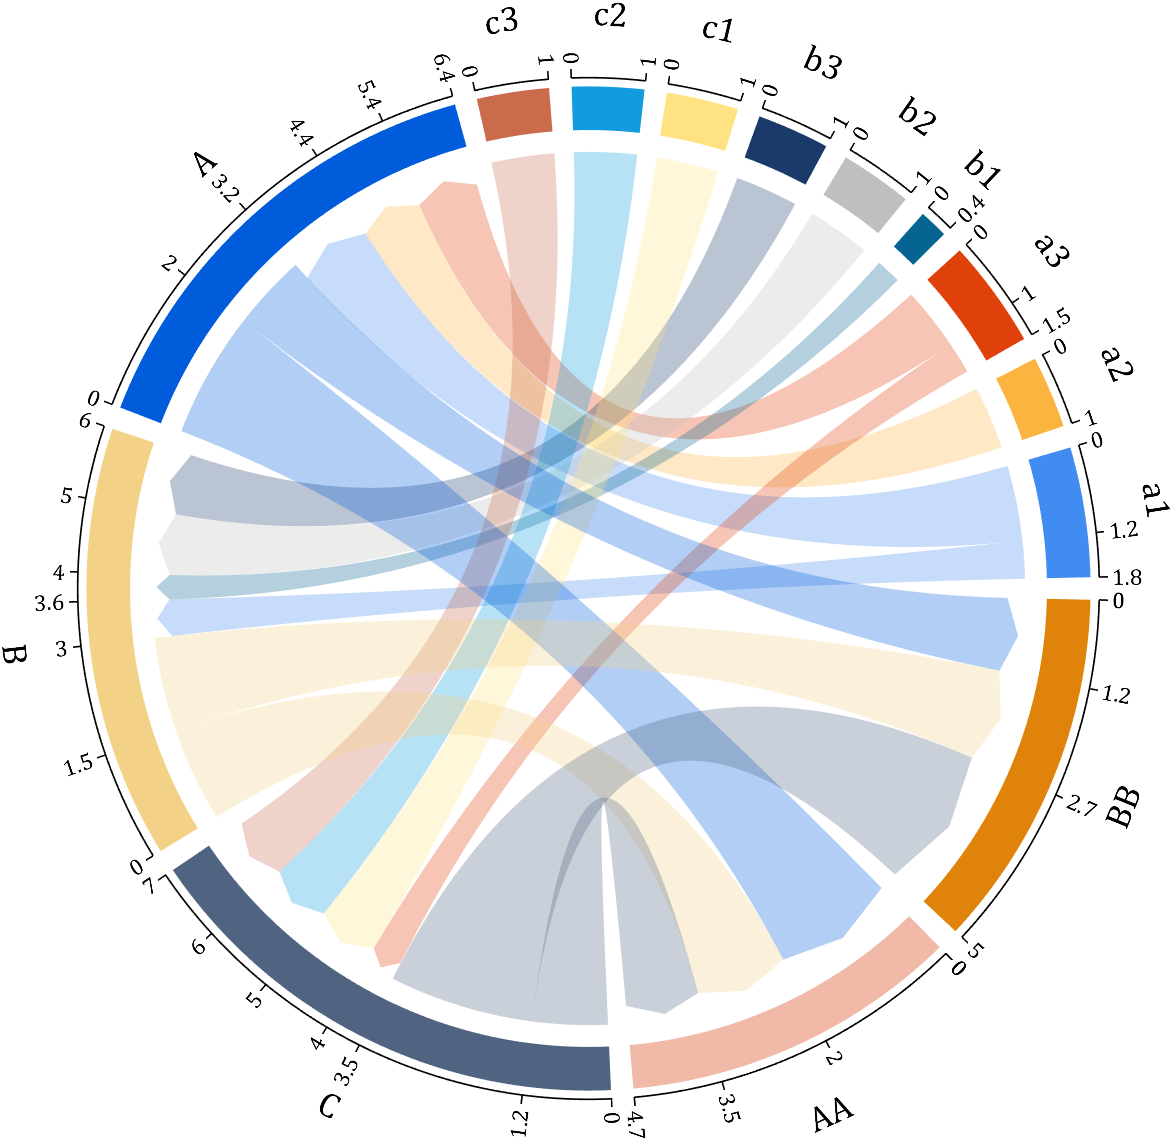
links={'a1','A',1.2;'a2','A',1;'a1','B',.6;'a3','A',1; 'a3','C',0.5;
'b1','B',.4; 'b2','B',1;'b3','B',1; 'c1','C',1;
'c2','C',1; 'c3','C',1;'A','AA',2; 'A','BB',1.2;
'B','BB',1.5; 'B','AA',1.5; 'C','BB',2.3; 'C','AA',1.2};
% 创建桑基图对象(Create a Sankey diagram object)
SK=SSankey(links(:,1),links(:,2),links(:,3));
% 开始绘图(Start drawing)
SK.draw()
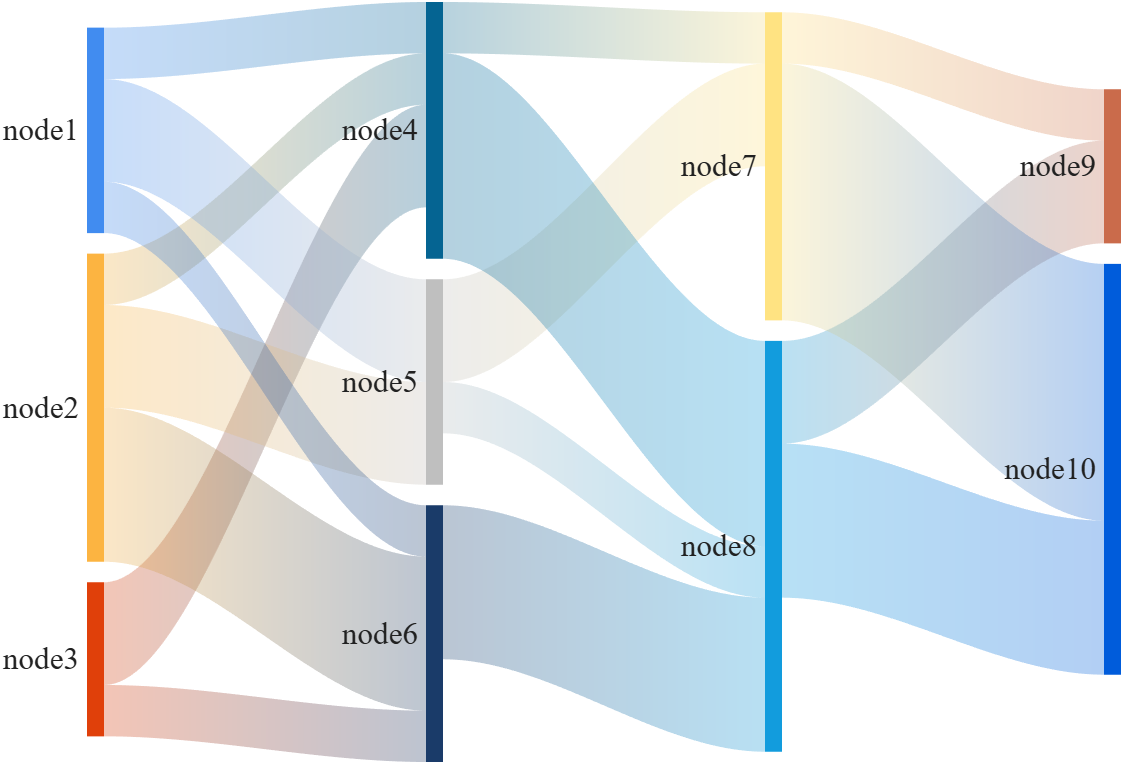
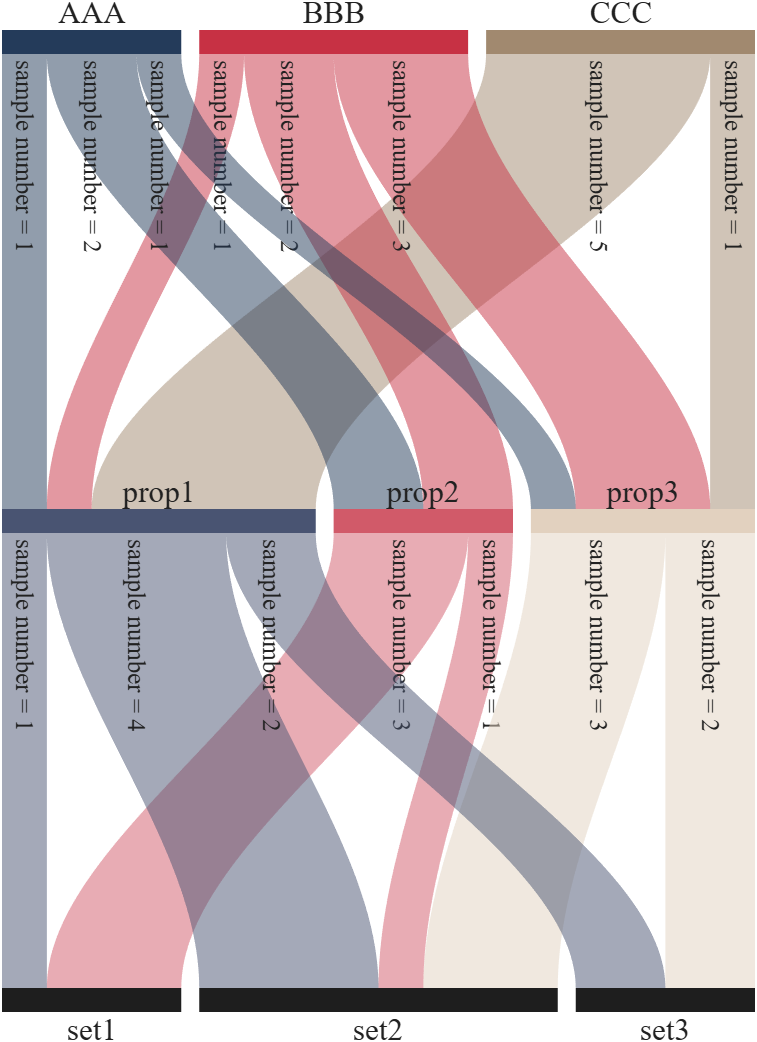
Basic usage - adjMat
% Define inter-layer adjacency matrices
% 定义层间邻接矩阵
A12 = [1,2,1; 1,2,3; 2,0,1];
A23 = [1,4; 2,1; 0,3];
A34 = [1,5; 2,3];
% Assemble global block matrix (main diagonal = zero, super-diagonal = A12, A23, A34)
% 组装全局分块矩阵(主对角线为零,上对角线为 A12, A23, A34)
adjMat = mergeAdjMat({A12, A23, A34});
SK = SSankey([],[],[], 'AdjMat',adjMat);
SK.draw()
Further usage examples can be found in the demos included in the compressed package:
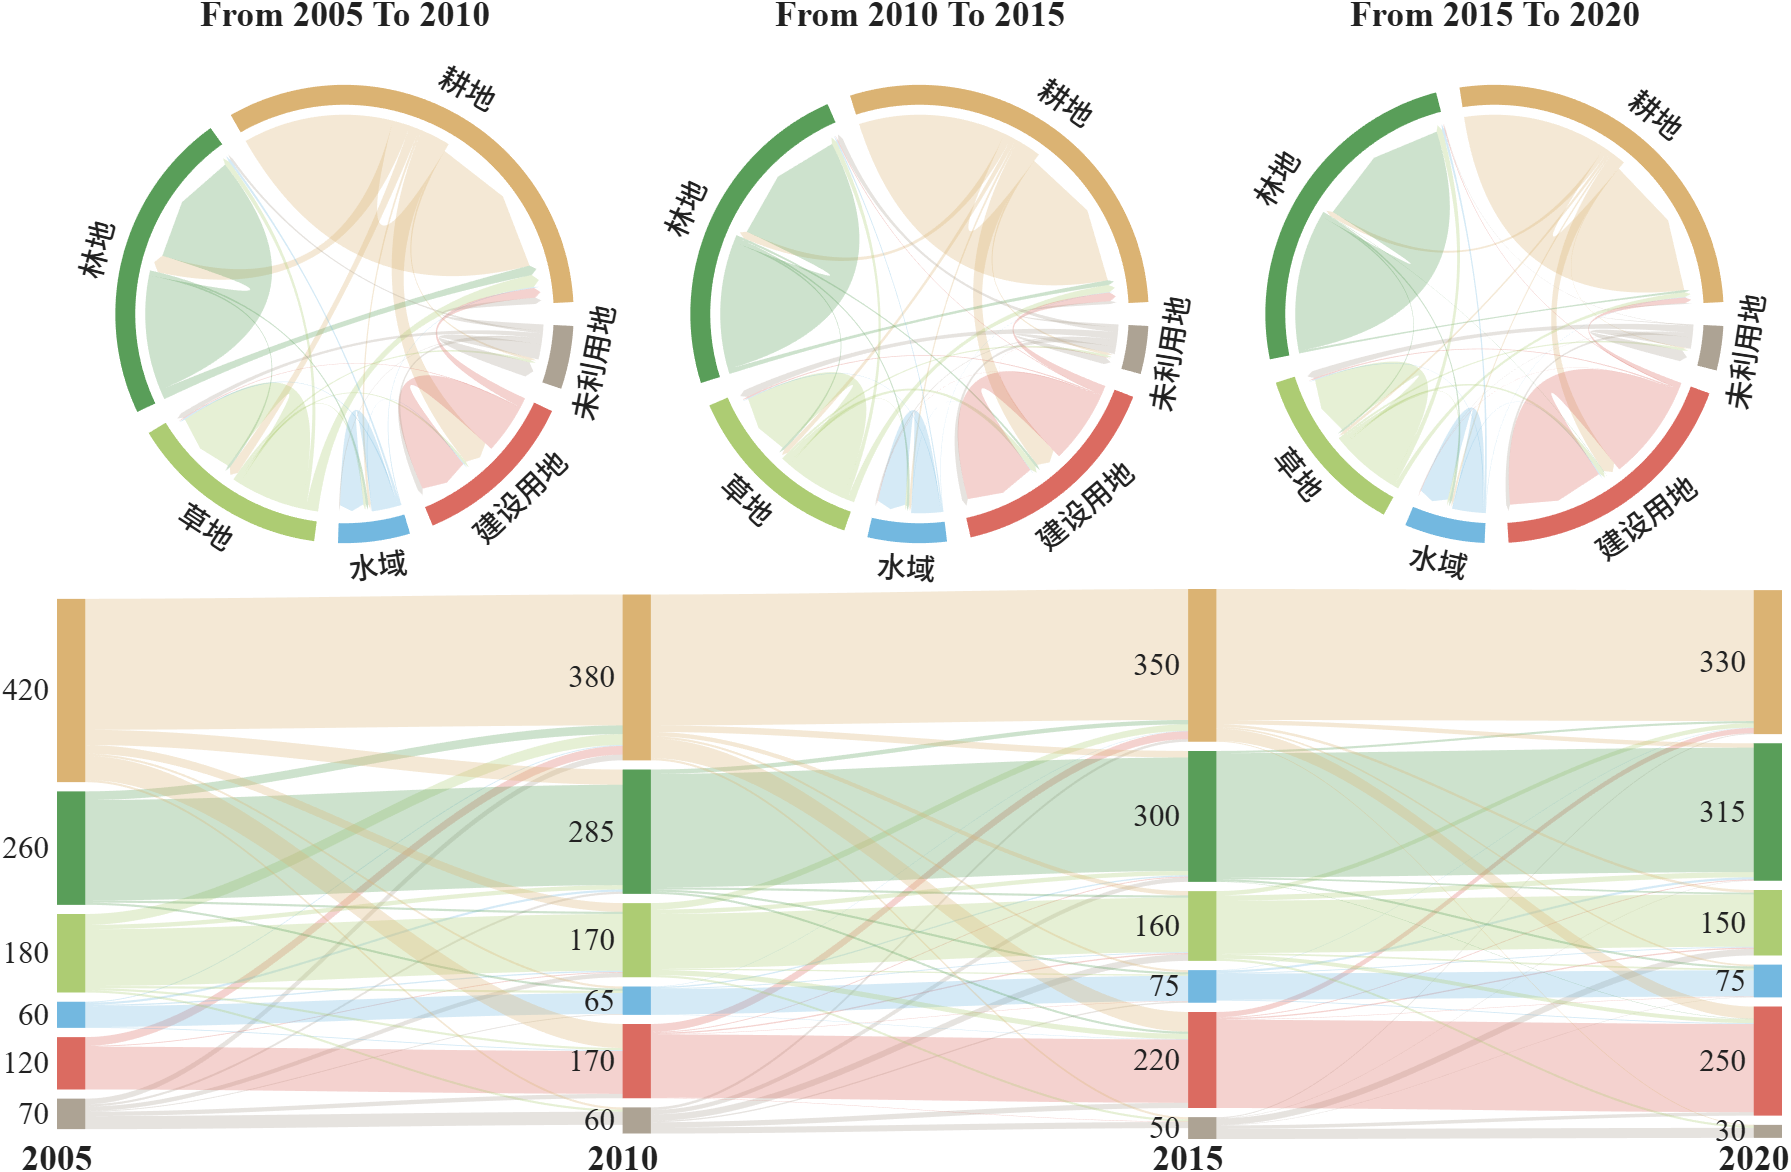
Chord diagrams are very common in Python and R, but there are no related functions in MATLAB before. It is not easy to draw chord diagrams of the same quality as R language, But I created a MATLAB tool that could almost do it.
↓ ↓ ↓ ↓ ↓ ↓ ↓ ↓ ↓ ↓
↑ ↑ ↑ ↑ ↑ ↑ ↑ ↑ ↑ ↑
Here is the help document:
1 Data Format
The data requirement is a numerical matrix with all values greater than or equal to 0, or a table array, or a numerical matrix and cell array for names. First, give an example of a numerical matrix:
1.1 Numerical Matrix
dataMat=randi([0,5],[5,4]);
% 绘图(draw)
CC=chordChart(dataMat);
CC=CC.draw();
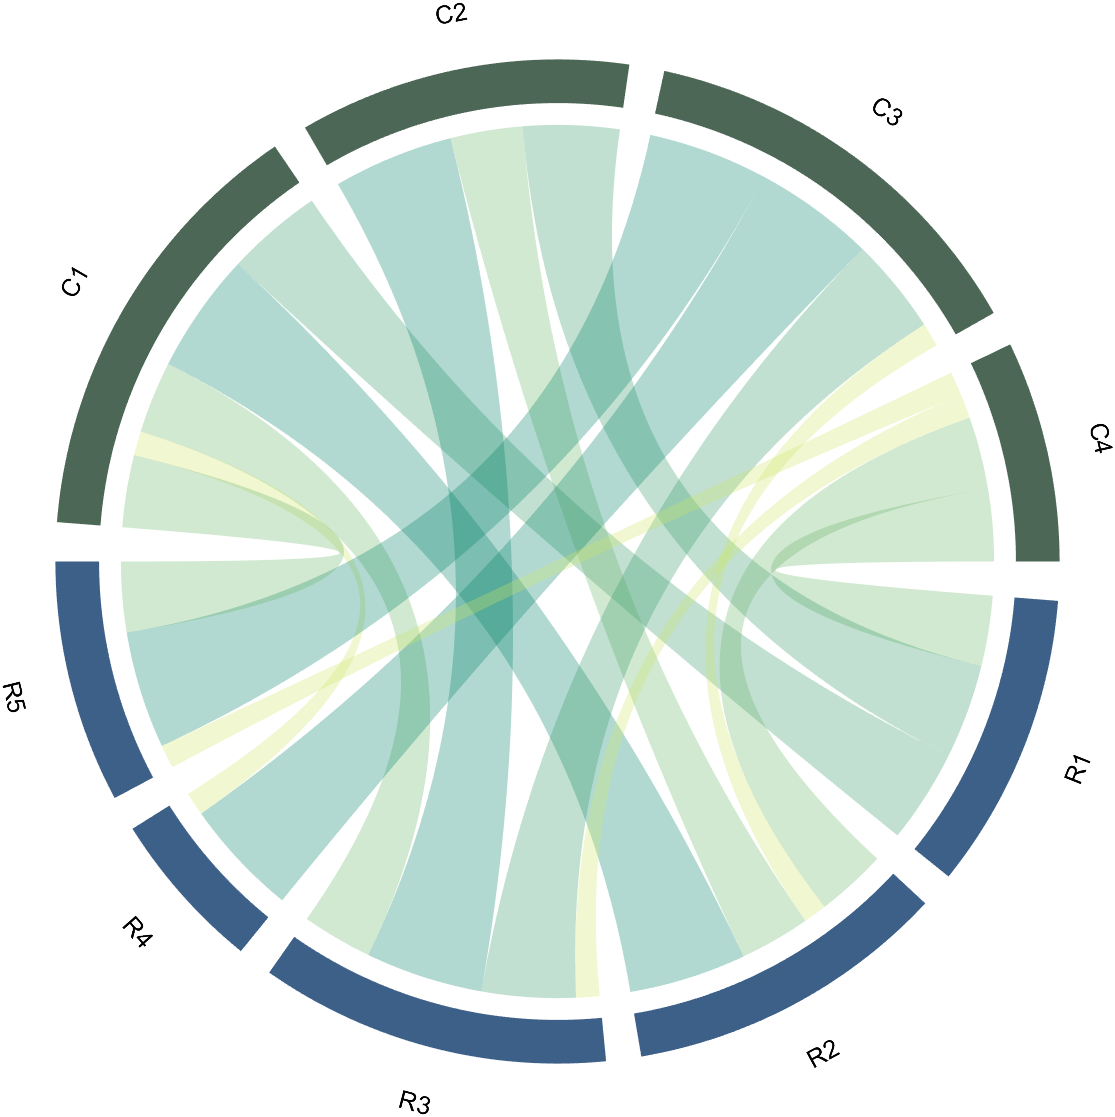
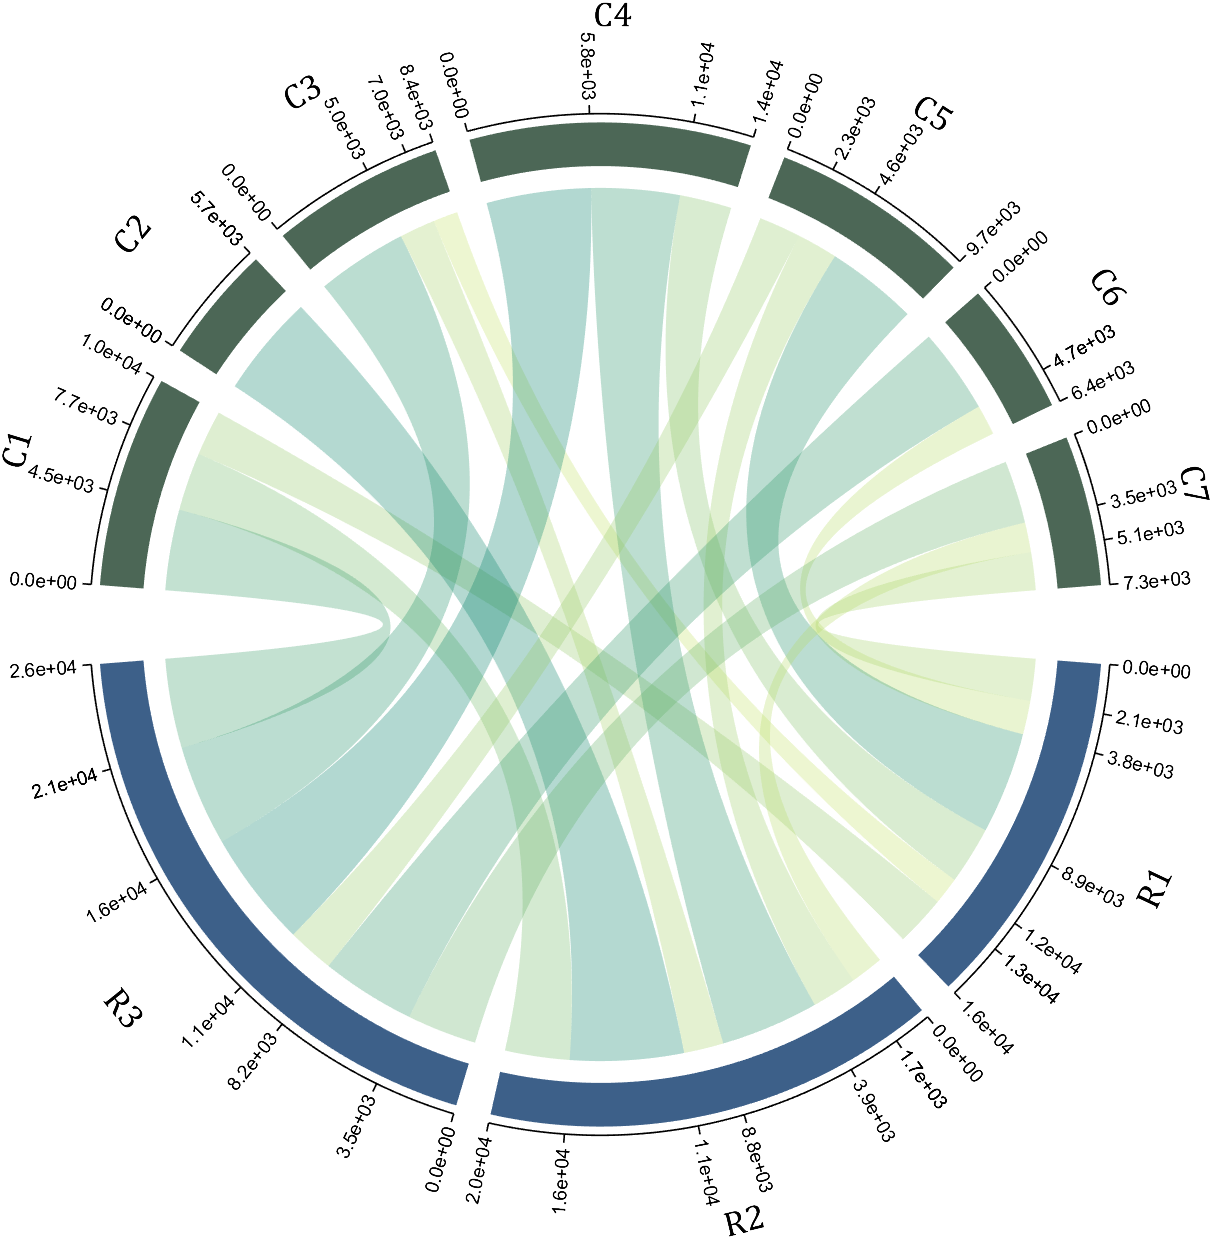
Since each object is not named, it will be automatically named Rn and Cn
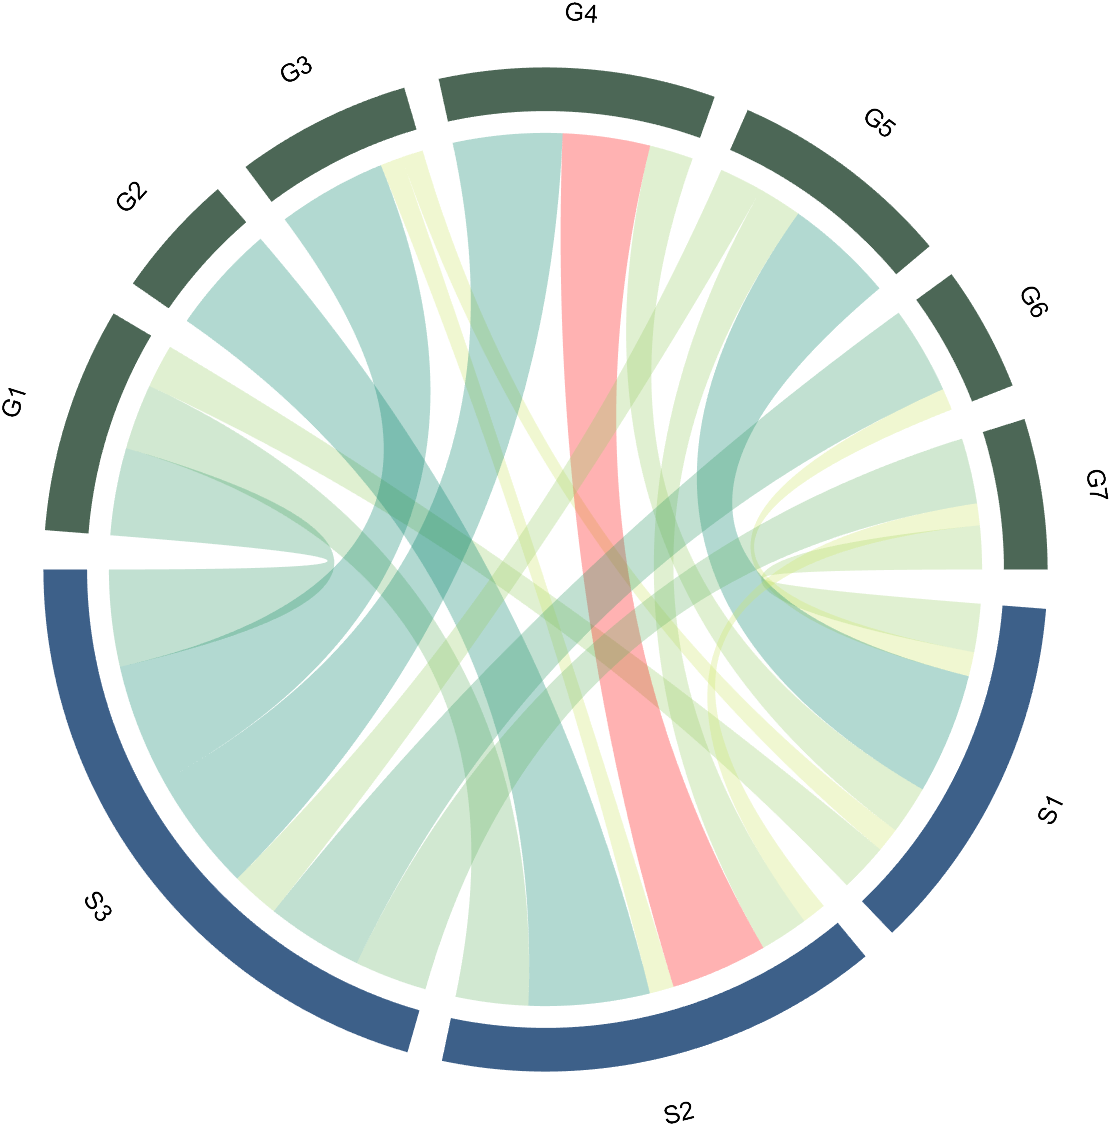
1.2 Numerical Matrix and Cell Array for Names
dataMat=[2 0 1 2 5 1 2;
3 5 1 4 2 0 1;
4 0 5 5 2 4 3];
colName={'G1','G2','G3','G4','G5','G6','G7'};
rowName={'S1','S2','S3'};
CC=chordChart(dataMat,'rowName',rowName,'colName',colName);
CC=CC.draw();

RowName should be the same size as the rows of the matrix
ColName should be the same size as the columns of the matrix
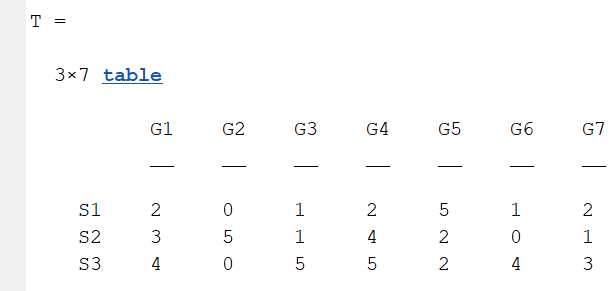
For this example, if the value in the second row and third column is 1, it indicates that there is an energy flow from S2 to G3, and a chord with a width of 1 is needed between these two.
1.3 Table Array
A table array in the following format is required:
2 Decorate Chord
2.1 Batch modification of chords
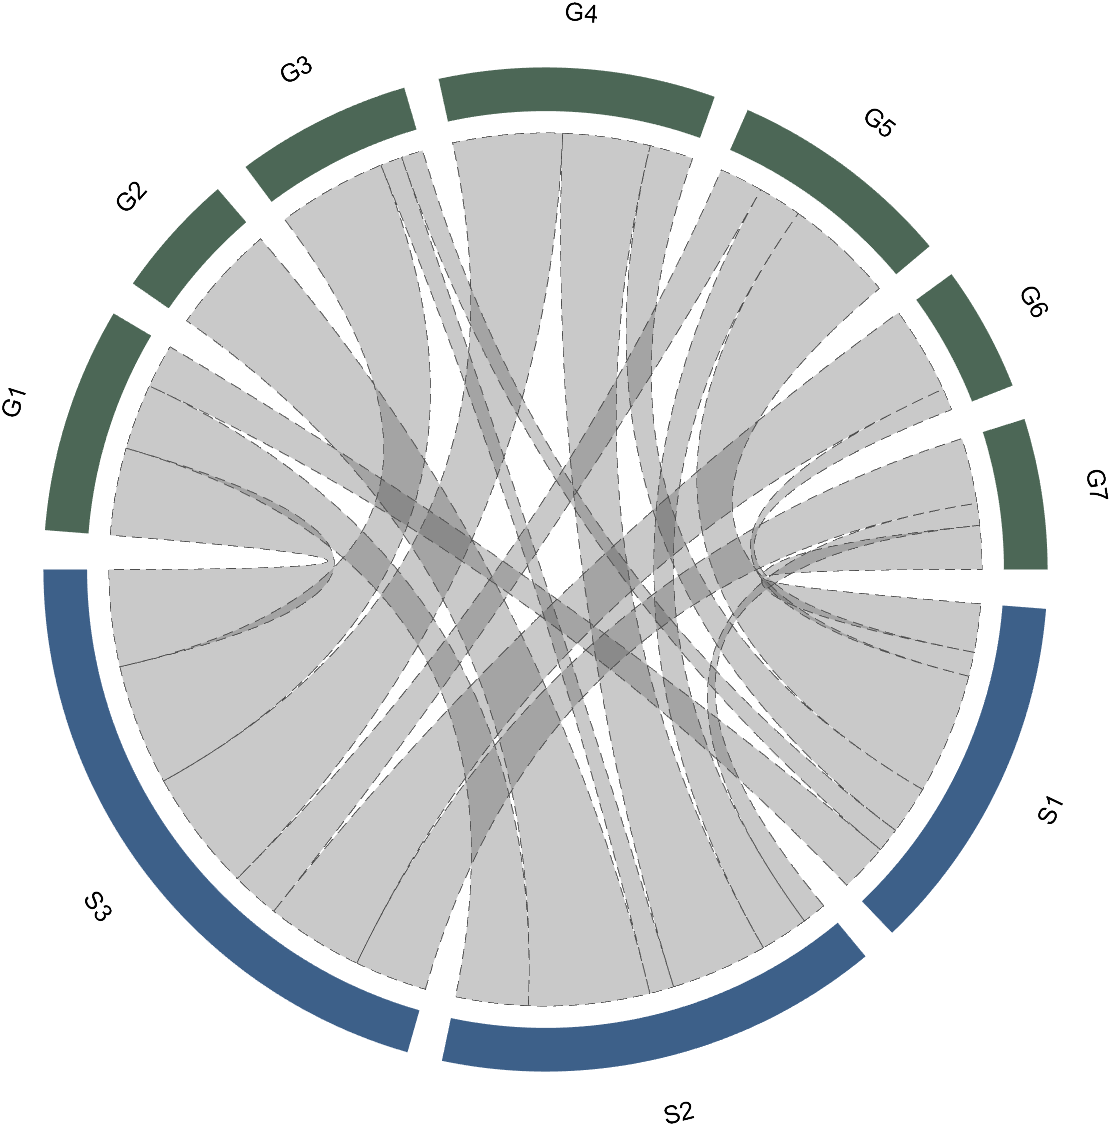
Batch modification of chords can be done using the setChordProp function, and all properties of the Patch object can be modified. For example, modifying the color of the string, edge color, edge line sstyle, etc.:
CC.setChordProp('EdgeColor',[.3,.3,.3],'LineStyle','--',...
'LineWidth',.1,'FaceColor',[.3,.3,.3])
2.2 Individual Modification of Chord
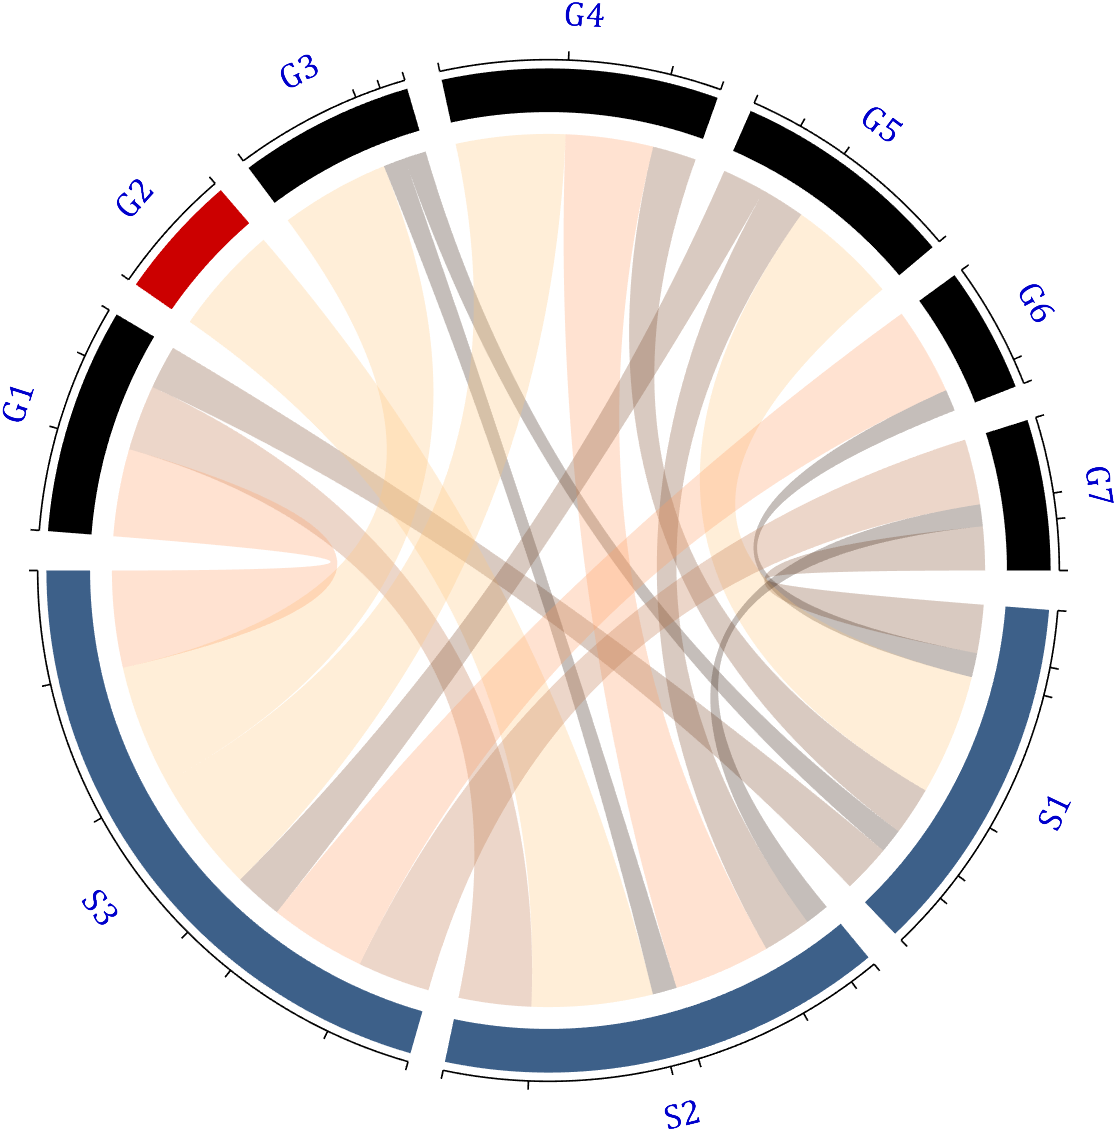
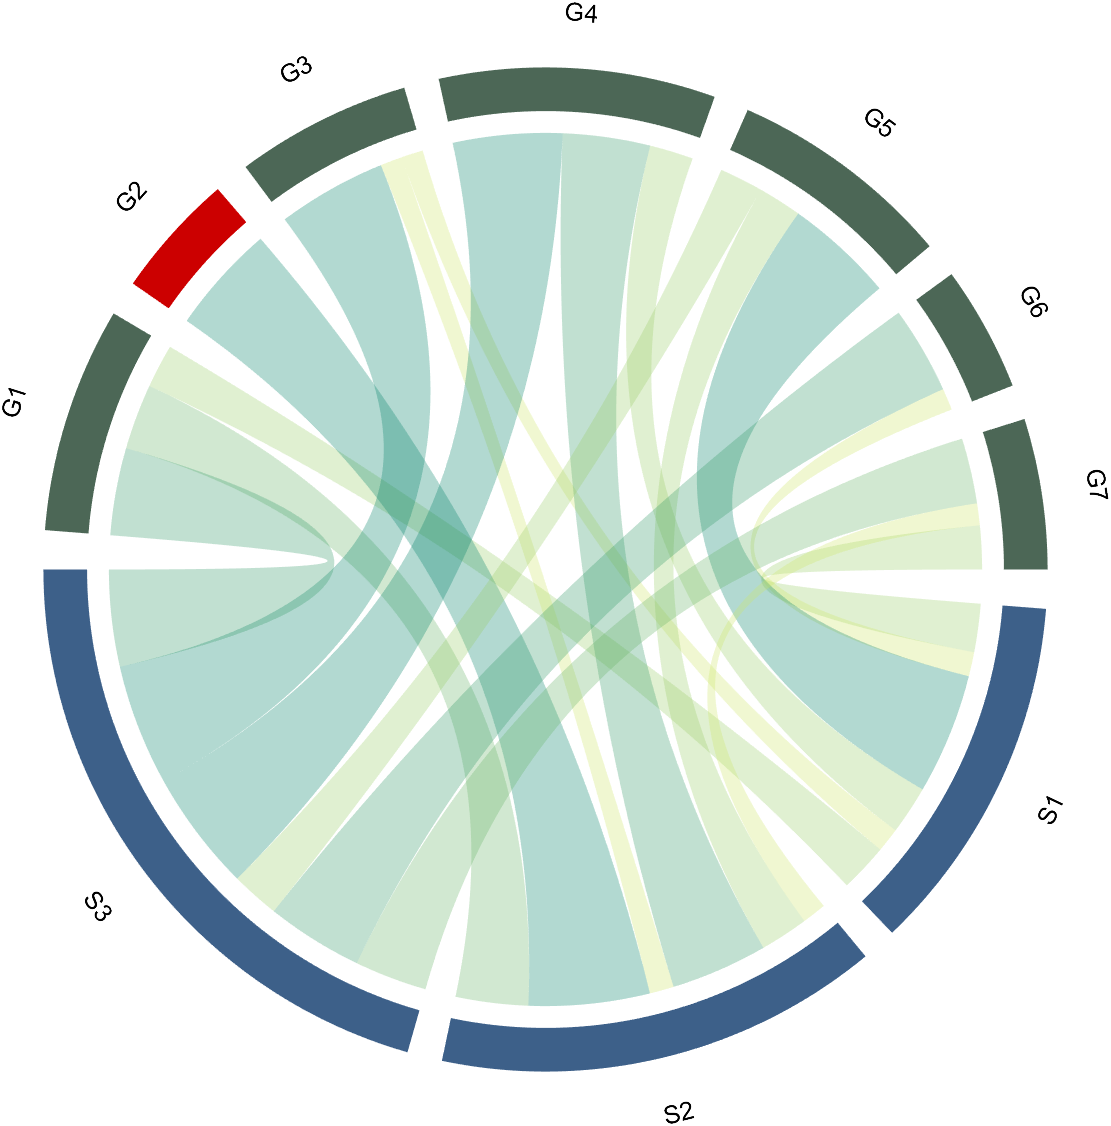
The individual modification of chord can be done using the setChordMN function, where the values of m and n correspond exactly to the rows and columns of the original numerical matrix. For example, changing the color of the strings flowing from S2 to G4 to red:
CC.setChordMN(2,4,'FaceColor',[1,0,0])
2.3 Color Mapping of Chords
Just use function colormap to do so:
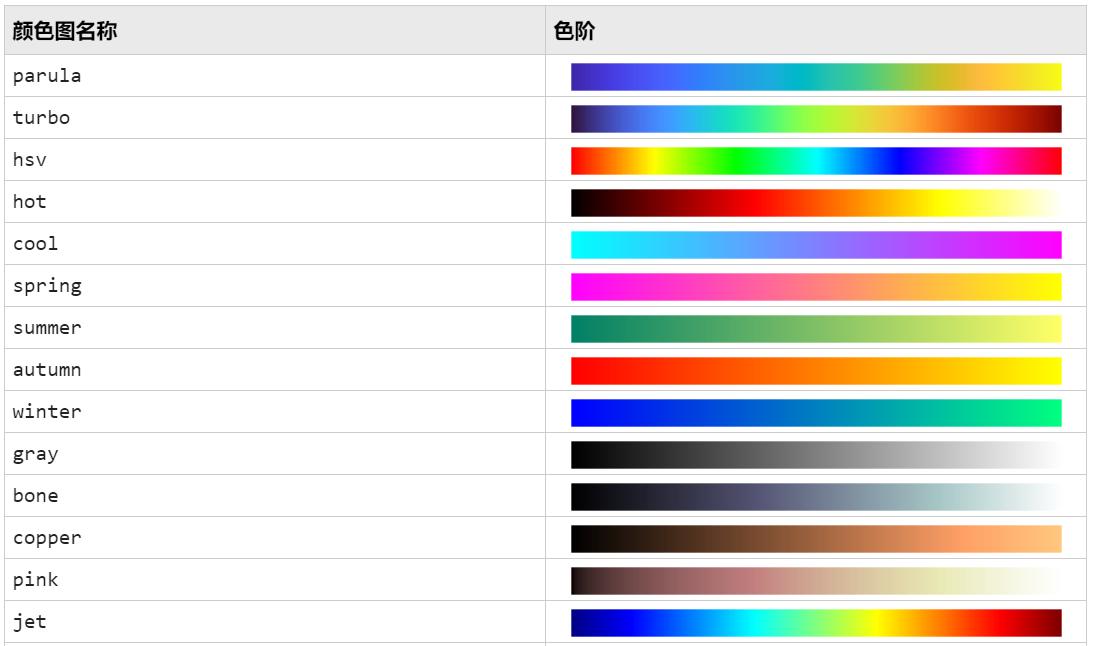
% version 1.7.0更新
% 可使用colormap函数直接修改颜色
% Colors can be adjusted directly using the function colormap(demo4)
colormap(flipud(pink))
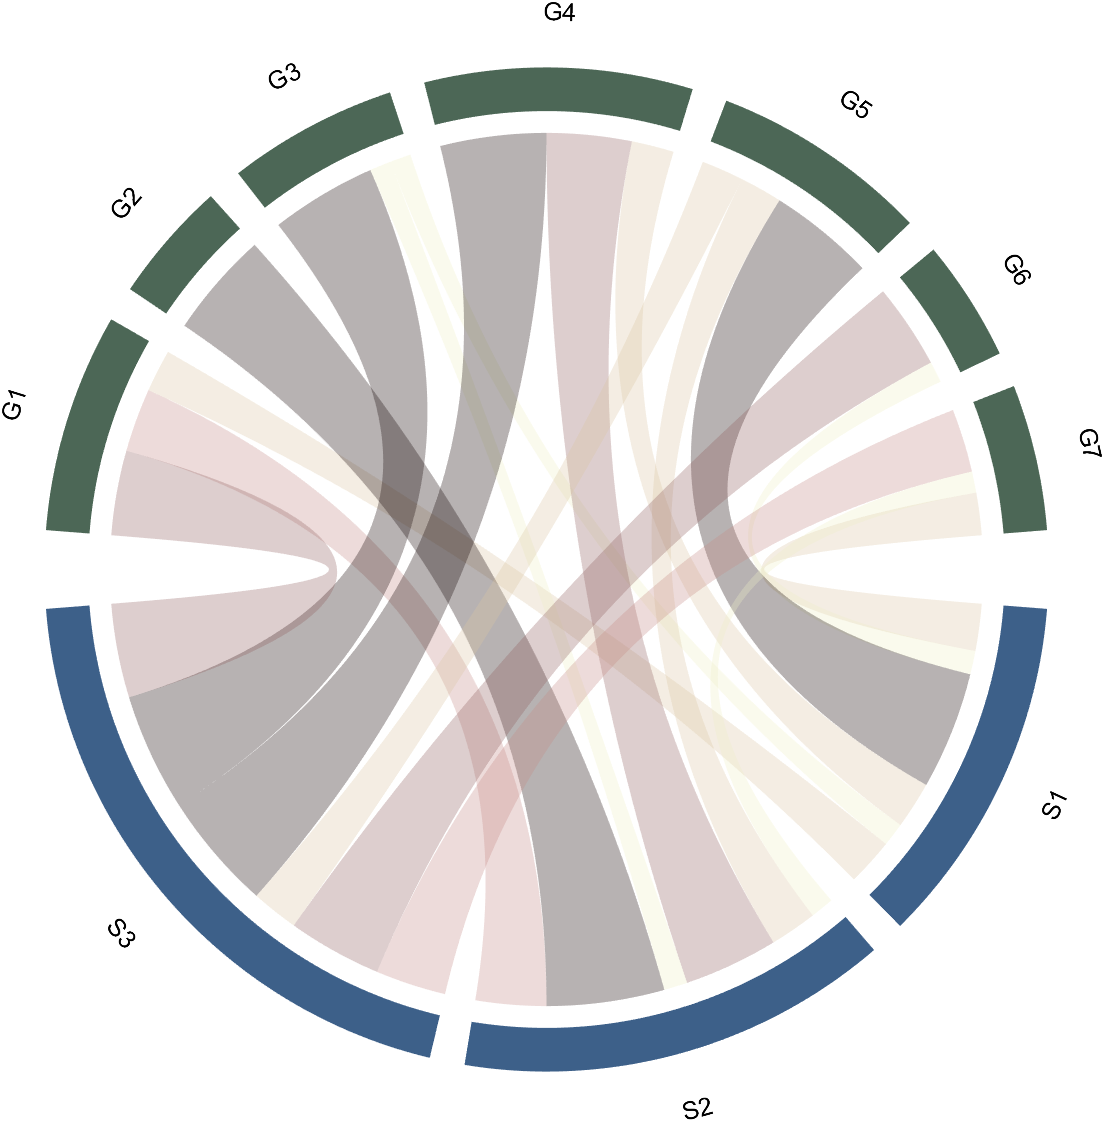
3 Arc Shaped Block Decoration
3.1 Batch Decoration of Arc-Shaped Blocks
use:
- setSquareT_Prop
- setSquareF_Prop
to modify the upper and lower blocks separately, and all attributes of the Patch object can be modified. For example, batch modify the upper blocks (change to black):
CC.setSquareT_Prop('FaceColor',[0,0,0])
3.2 Arc-Shaped Blocks Individually Decoration
use:
- setSquareT_N
- setSquareF_N
to modify the upper and lower blocks separately. For example, modify the second block above separately (changed to red):
CC.setSquareT_N(2,'FaceColor',[.8,0,0])
4 Font Adjustment
Use the setFont function to adjust the font, and all properties of the text object can be modified. For example, changing the font size, font, and color of the text:
CC.setFont('FontSize',25,'FontName','Cambria','Color',[0,0,.8])
5 Show and Hide Ticks
Usage:
CC.tickState('on')
% CC.tickState('off')
6 Attribute 'Sep' with Adjustable Square Spacing
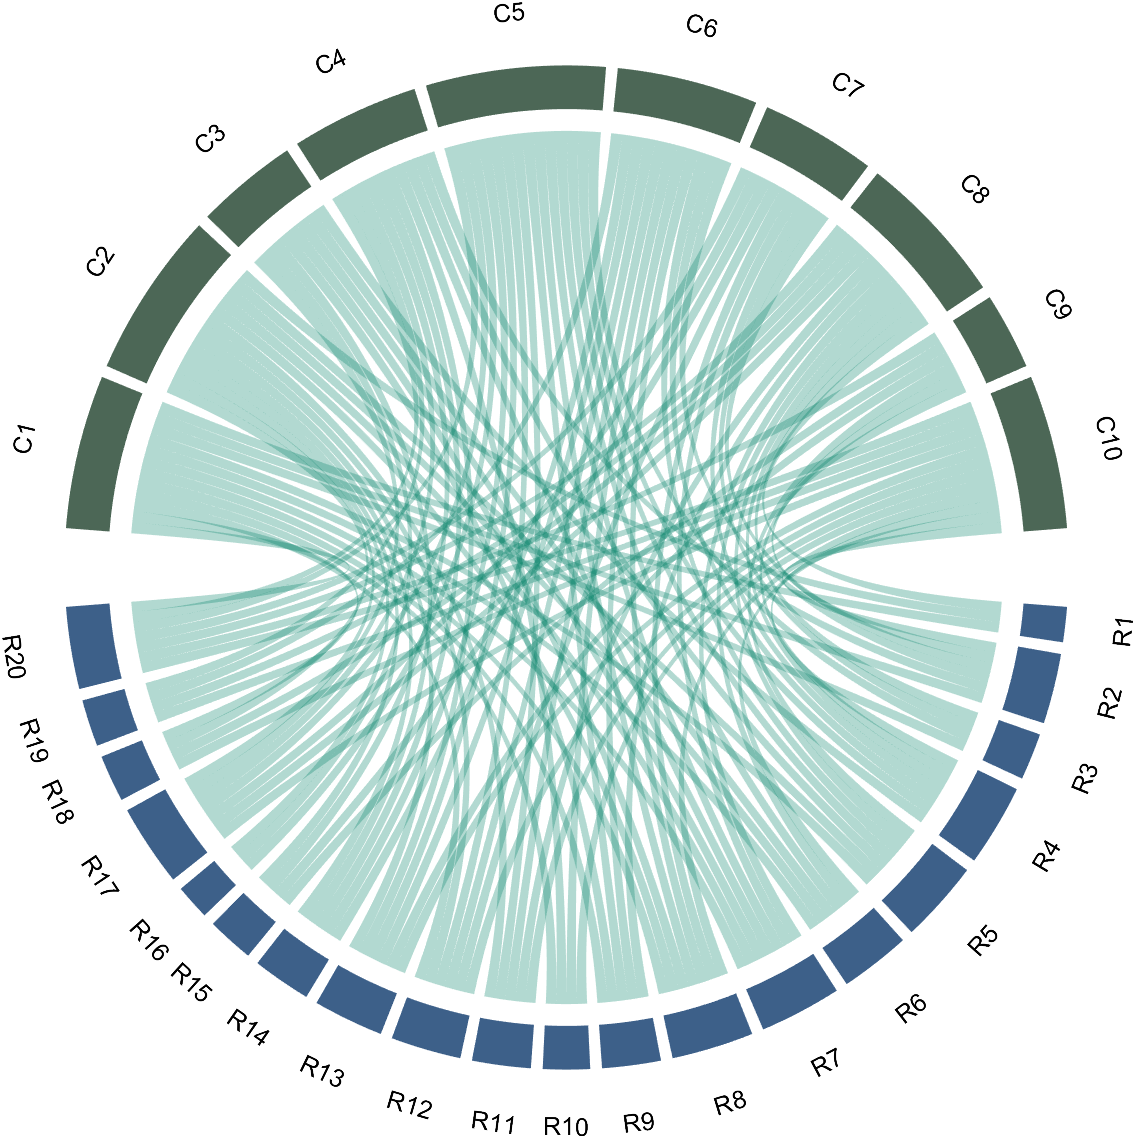
If the matrix size is large, the drawing will be out of scale:
dataMat=randi([0,1],[20,10]);
CC=chordChart(dataMat);
CC=CC.draw();
% CC.tickState('on')
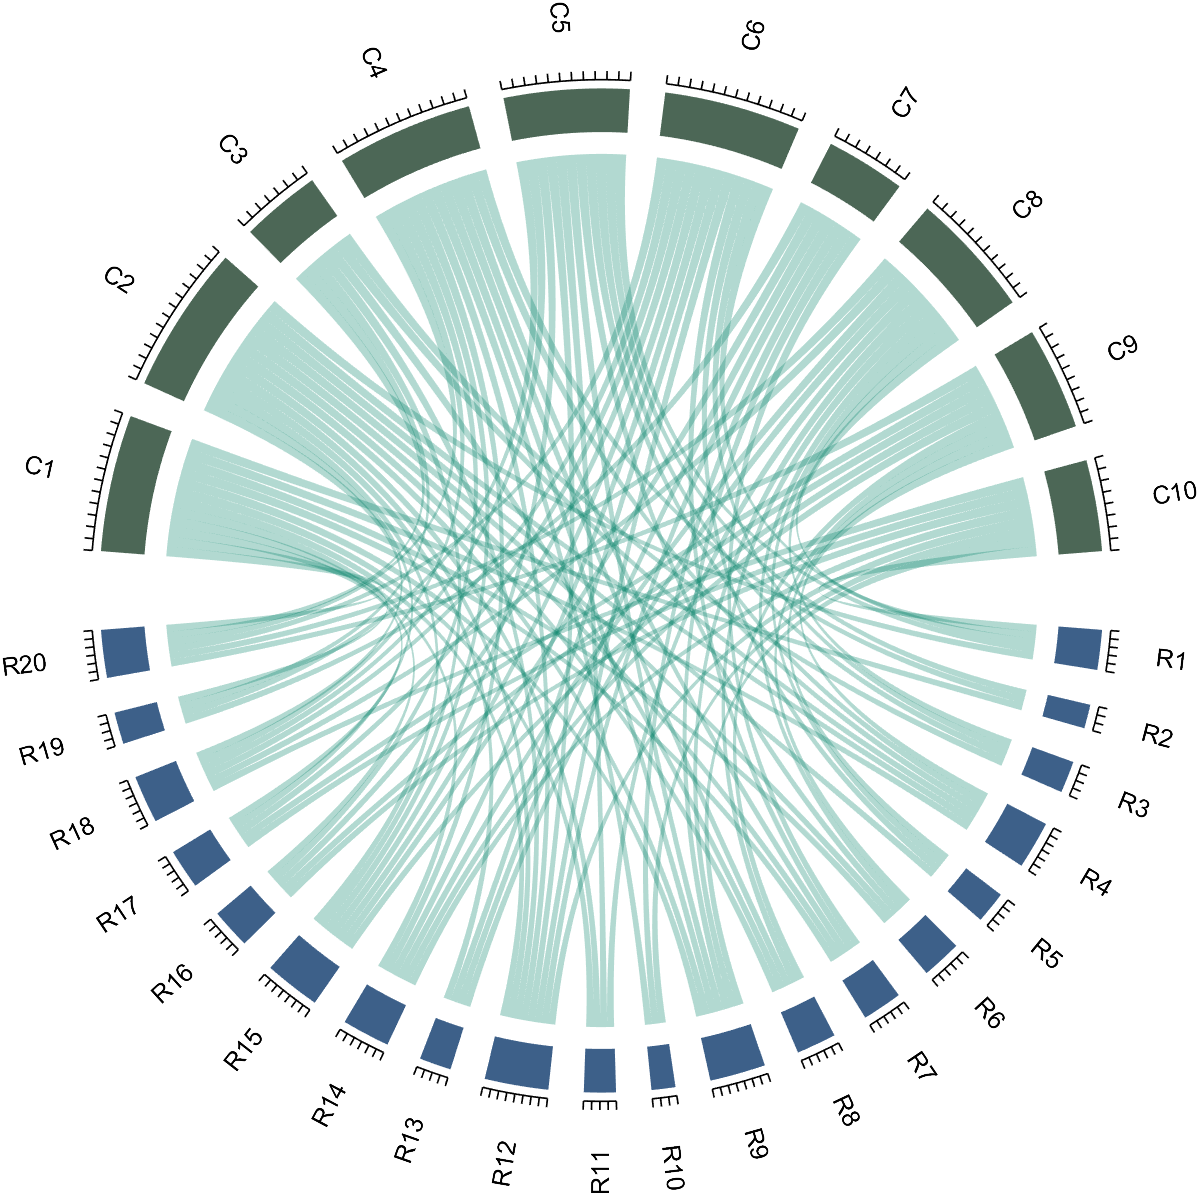
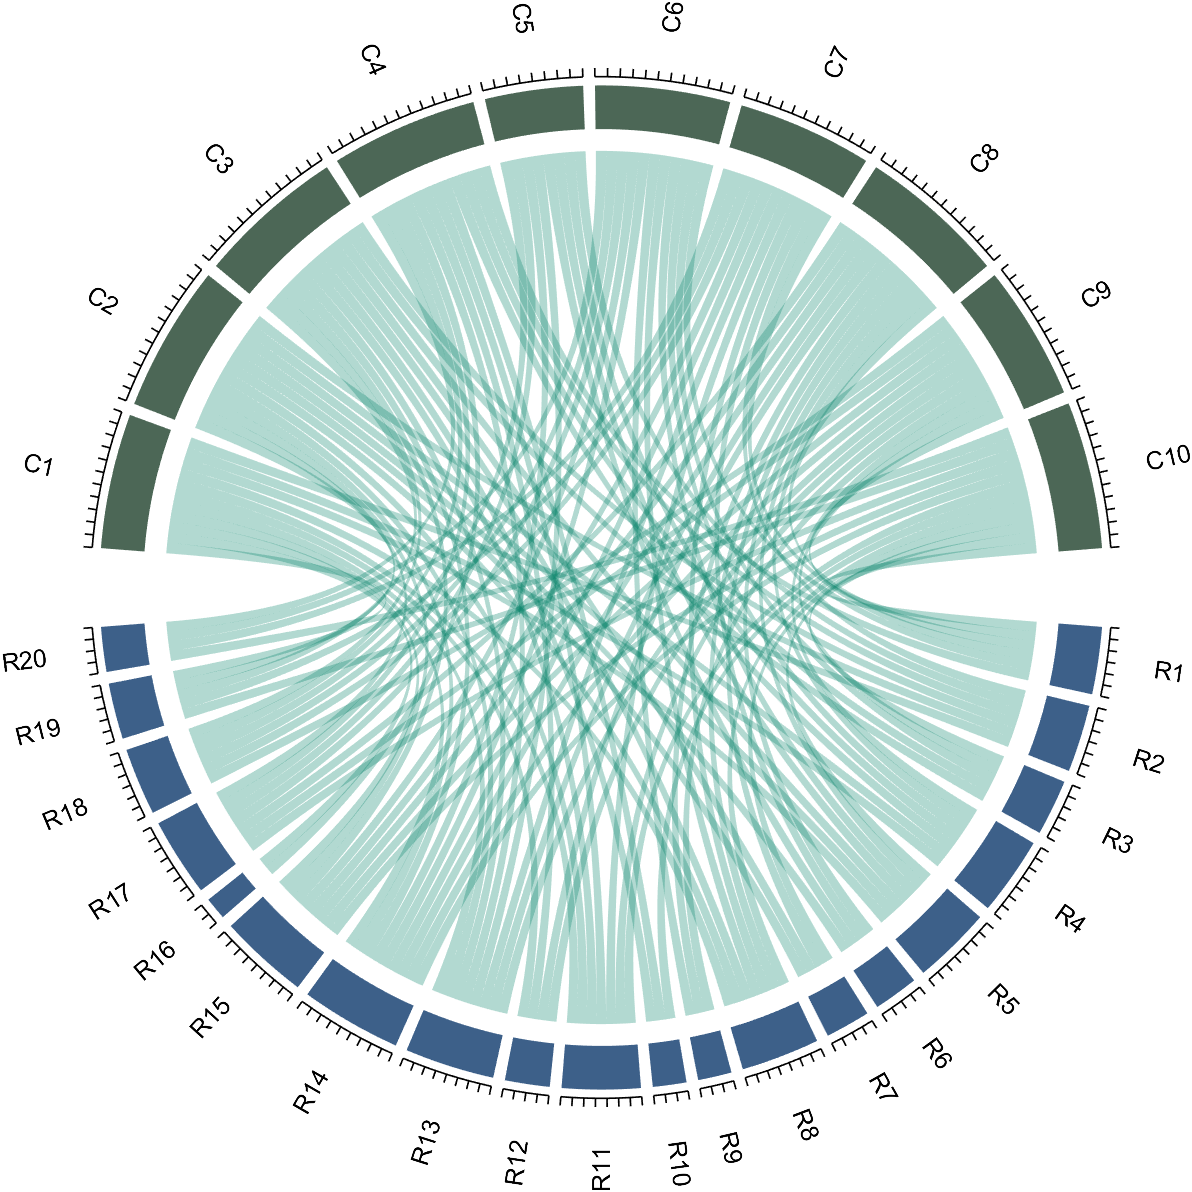
We can modify its Sep attribute:
dataMat=randi([0,1],[20,10]);
% use Sep to decrease space (separation)
% 使用 sep 减小空隙
CC=chordChart(dataMat,'Sep',1/120);
CC=CC.draw();
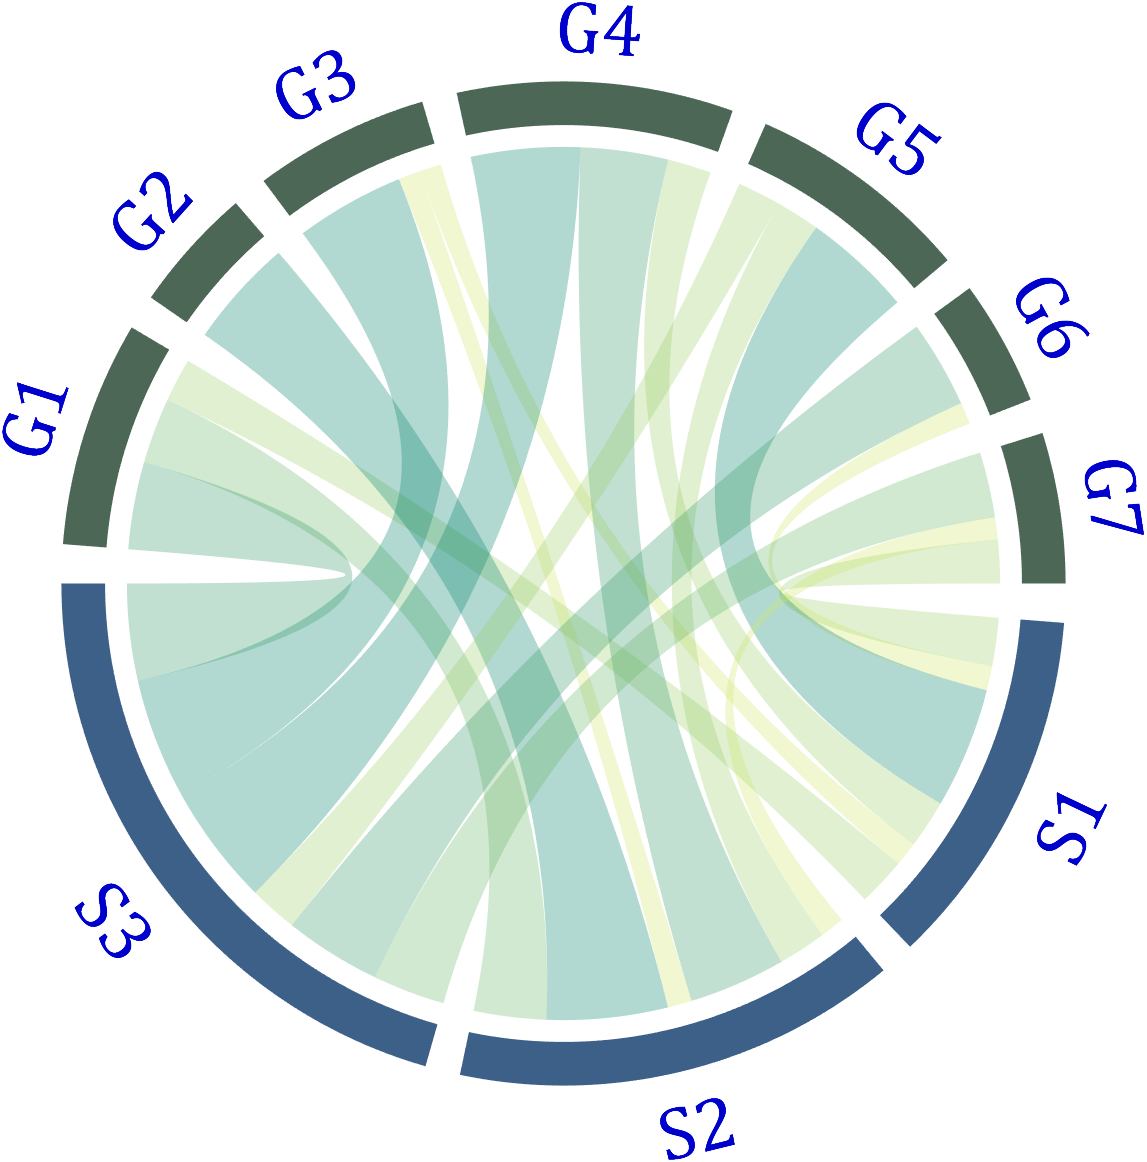
7 Modify Text Direction
dataMat=randi([0,1],[20,10]);
% use Sep to decrease space (separation)
% 使用 sep 减小空隙
CC=chordChart(dataMat,'Sep',1/120);
CC=CC.draw();
CC.tickState('on')
% version 1.7.0更新
% 函数labelRatato用来旋转标签
% The function labelRatato is used to rotate the label
CC.labelRotate('on')
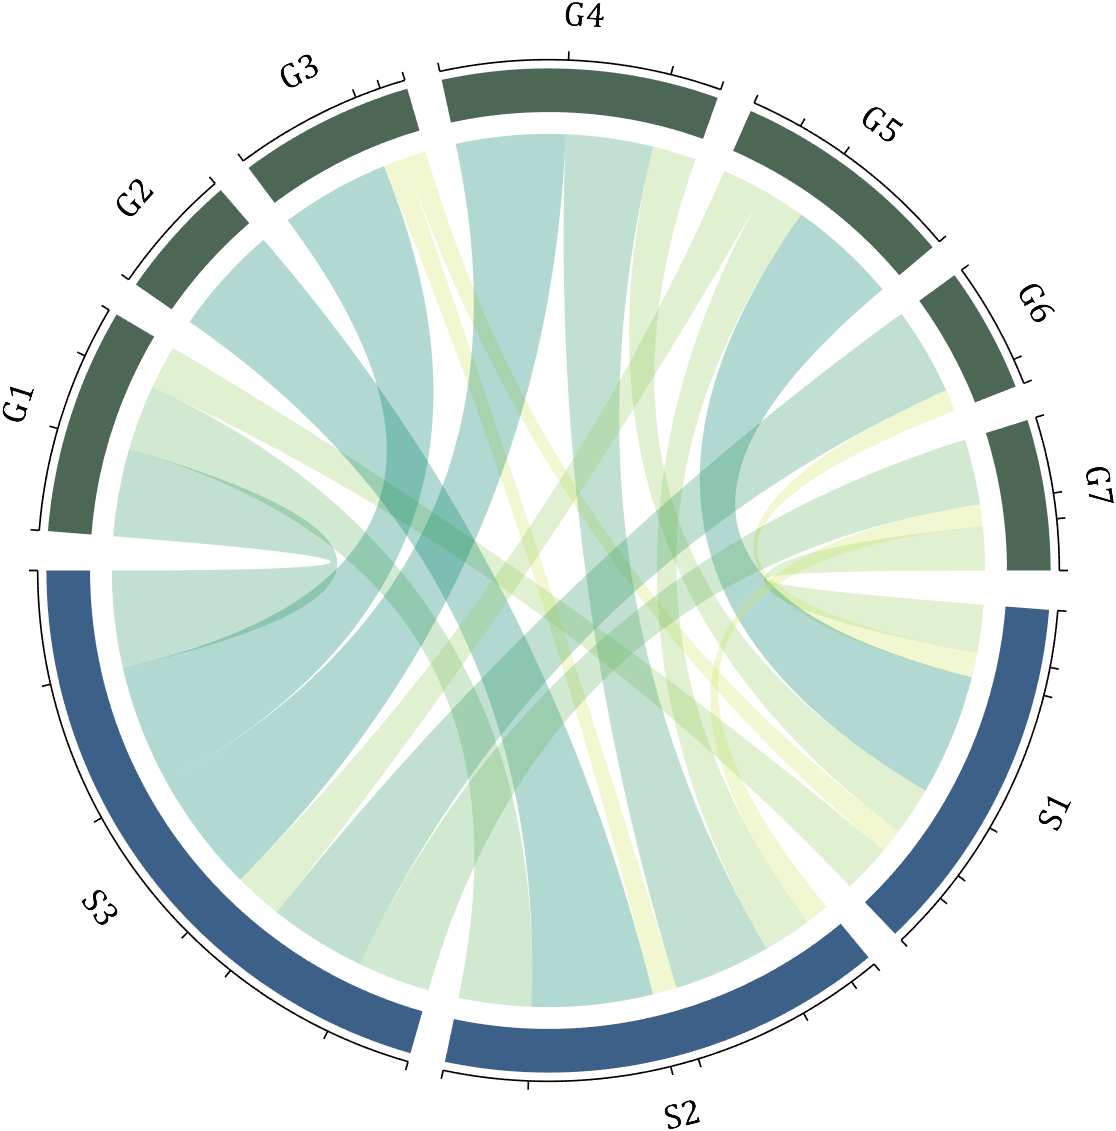
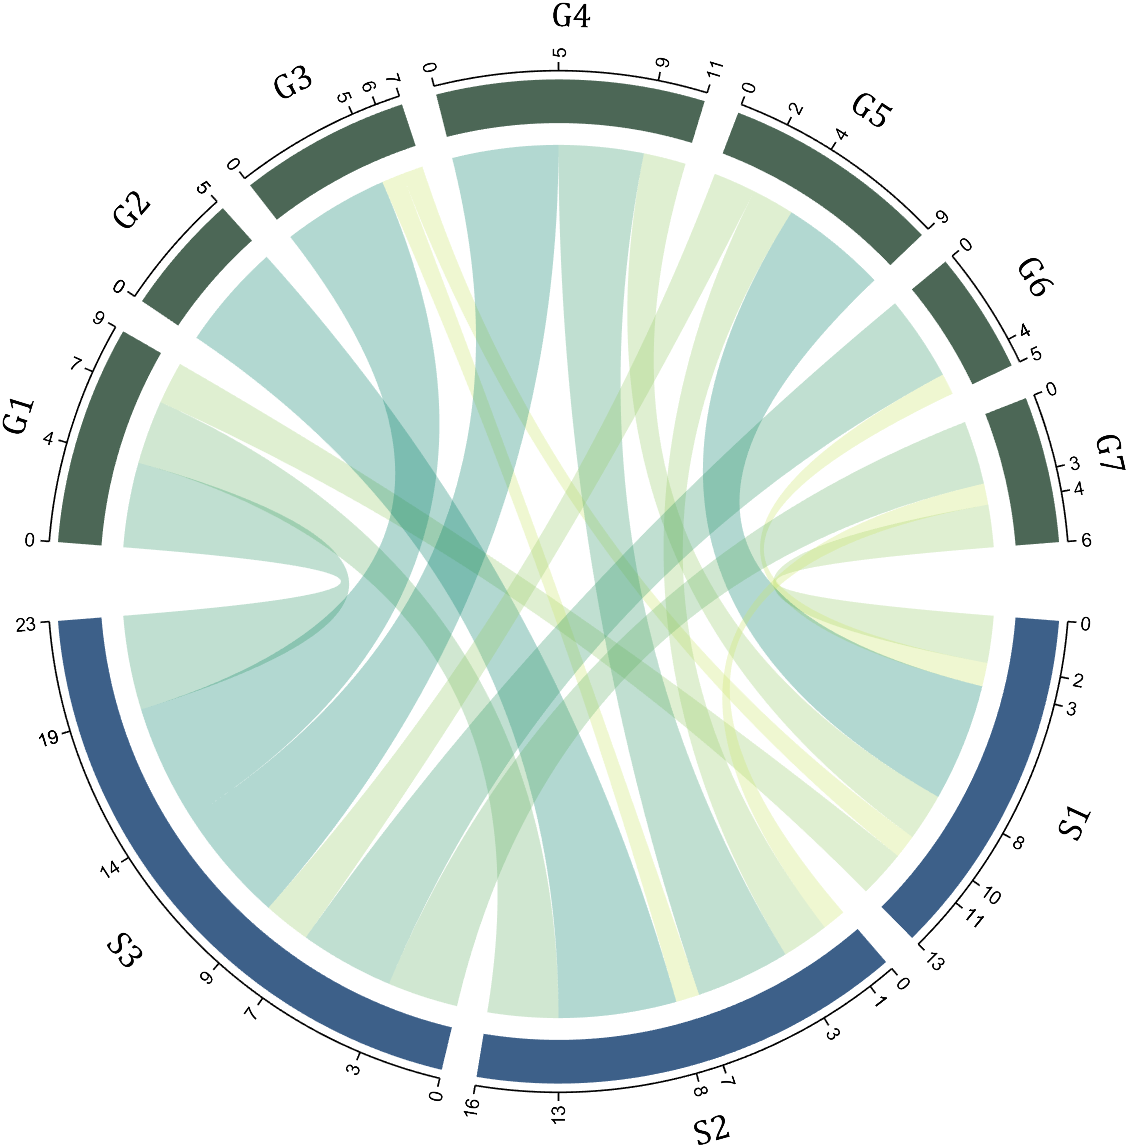
8 Add Tick Labels
dataMat=[2 0 1 2 5 1 2;
3 5 1 4 2 0 1;
4 0 5 5 2 4 3];
colName={'G1','G2','G3','G4','G5','G6','G7'};
rowName={'S1','S2','S3'};
CC=chordChart(dataMat,'rowName',rowName,'colName',colName);
CC=CC.draw();
CC.setFont('FontSize',17,'FontName','Cambria')
% 显示刻度和数值
% Displays scales and numeric values
CC.tickState('on')
CC.tickLabelState('on')
% 调节标签半径
% Adjustable Label radius
CC.setLabelRadius(1.3);
% figure()
% dataMat=[2 0 1 2 5 1 2;
% 3 5 1 4 2 0 1;
% 4 0 5 5 2 4 3];
% dataMat=dataMat+rand(3,7);
% dataMat(dataMat<1)=0;
%
% CC=chordChart(dataMat,'rowName',rowName,'colName',colName);
% CC=CC.draw();
% CC.setFont('FontSize',17,'FontName','Cambria')
%
% % 显示刻度和数值
% % Displays scales and numeric values
% CC.tickState('on')
% CC.tickLabelState('on')
%
% % 调节标签半径
% % Adjustable Label radius
% CC.setLabelRadius(1.4);
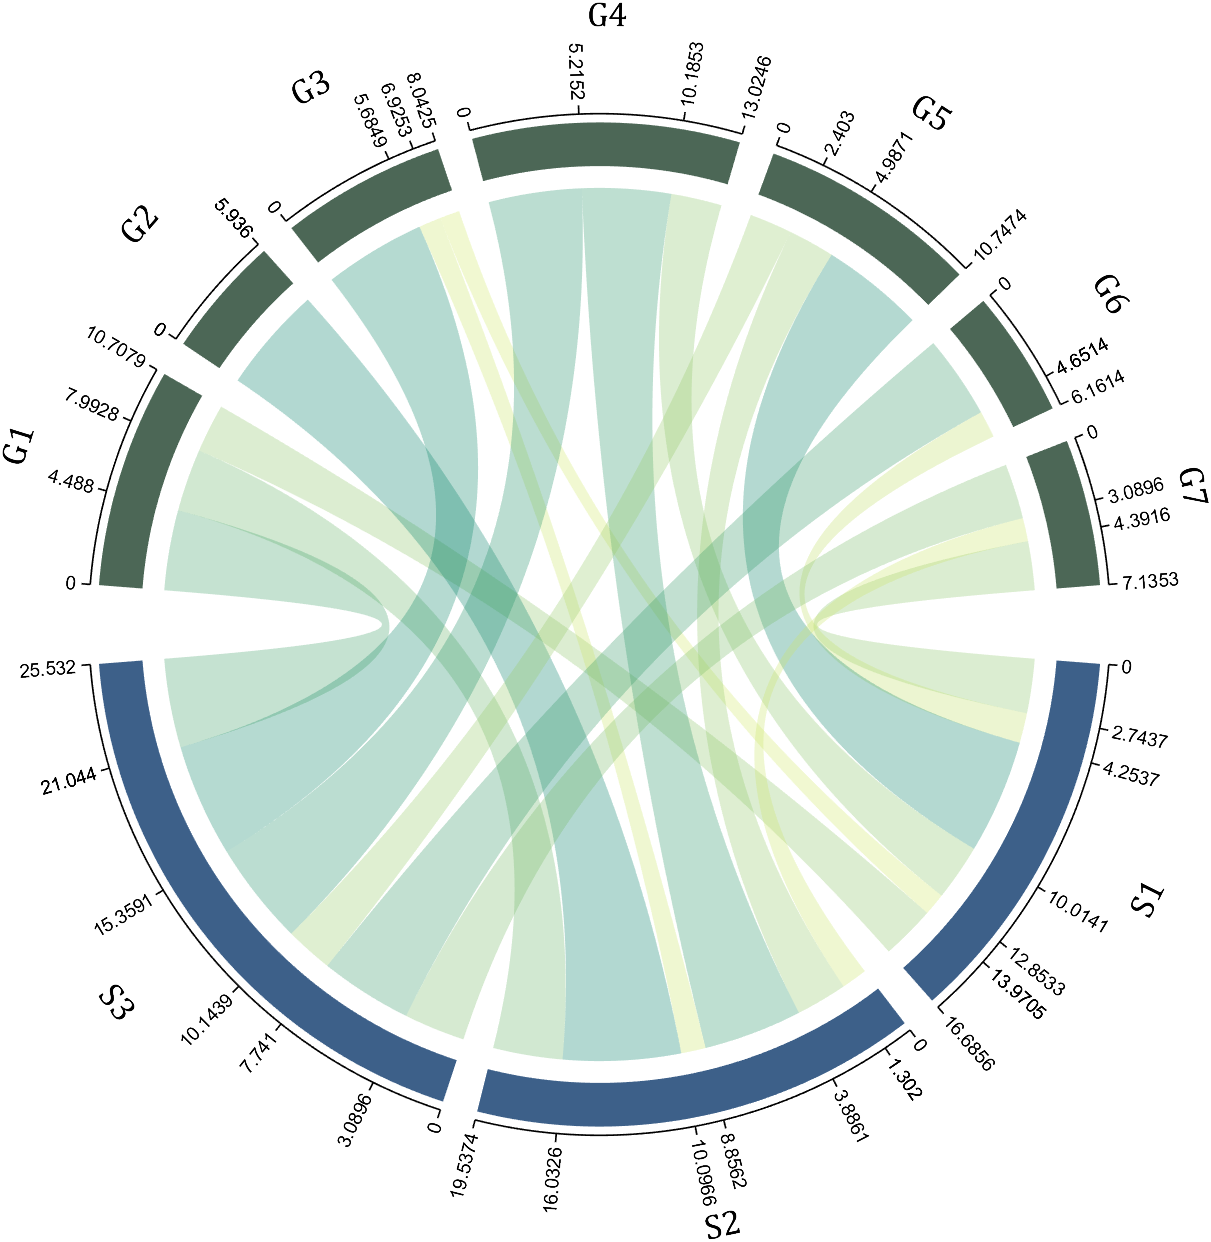
9 Custom Tick Label Format
A function handle is required to input numeric output strings. The format can be set through the setTickLabelFormat function, such as Scientific notation:
dataMat=[2 0 1 2 5 1 2;
3 5 1 4 2 0 1;
4 0 5 5 2 4 3];
dataMat=dataMat+rand(3,7);
dataMat(dataMat<1)=0;
dataMat=dataMat.*1000;
CC=chordChart(dataMat);
CC=CC.draw();
CC.setFont('FontSize',17,'FontName','Cambria')
% 显示刻度和数值
% Displays scales and numeric values
CC.tickState('on')
CC.tickLabelState('on')
% 调节标签半径
% Adjustable Label radius
CC.setLabelRadius(1.4);
% 调整数值字符串格式
% Adjust numeric string format
CC.setTickLabelFormat(@(x)sprintf('%0.1e',x))
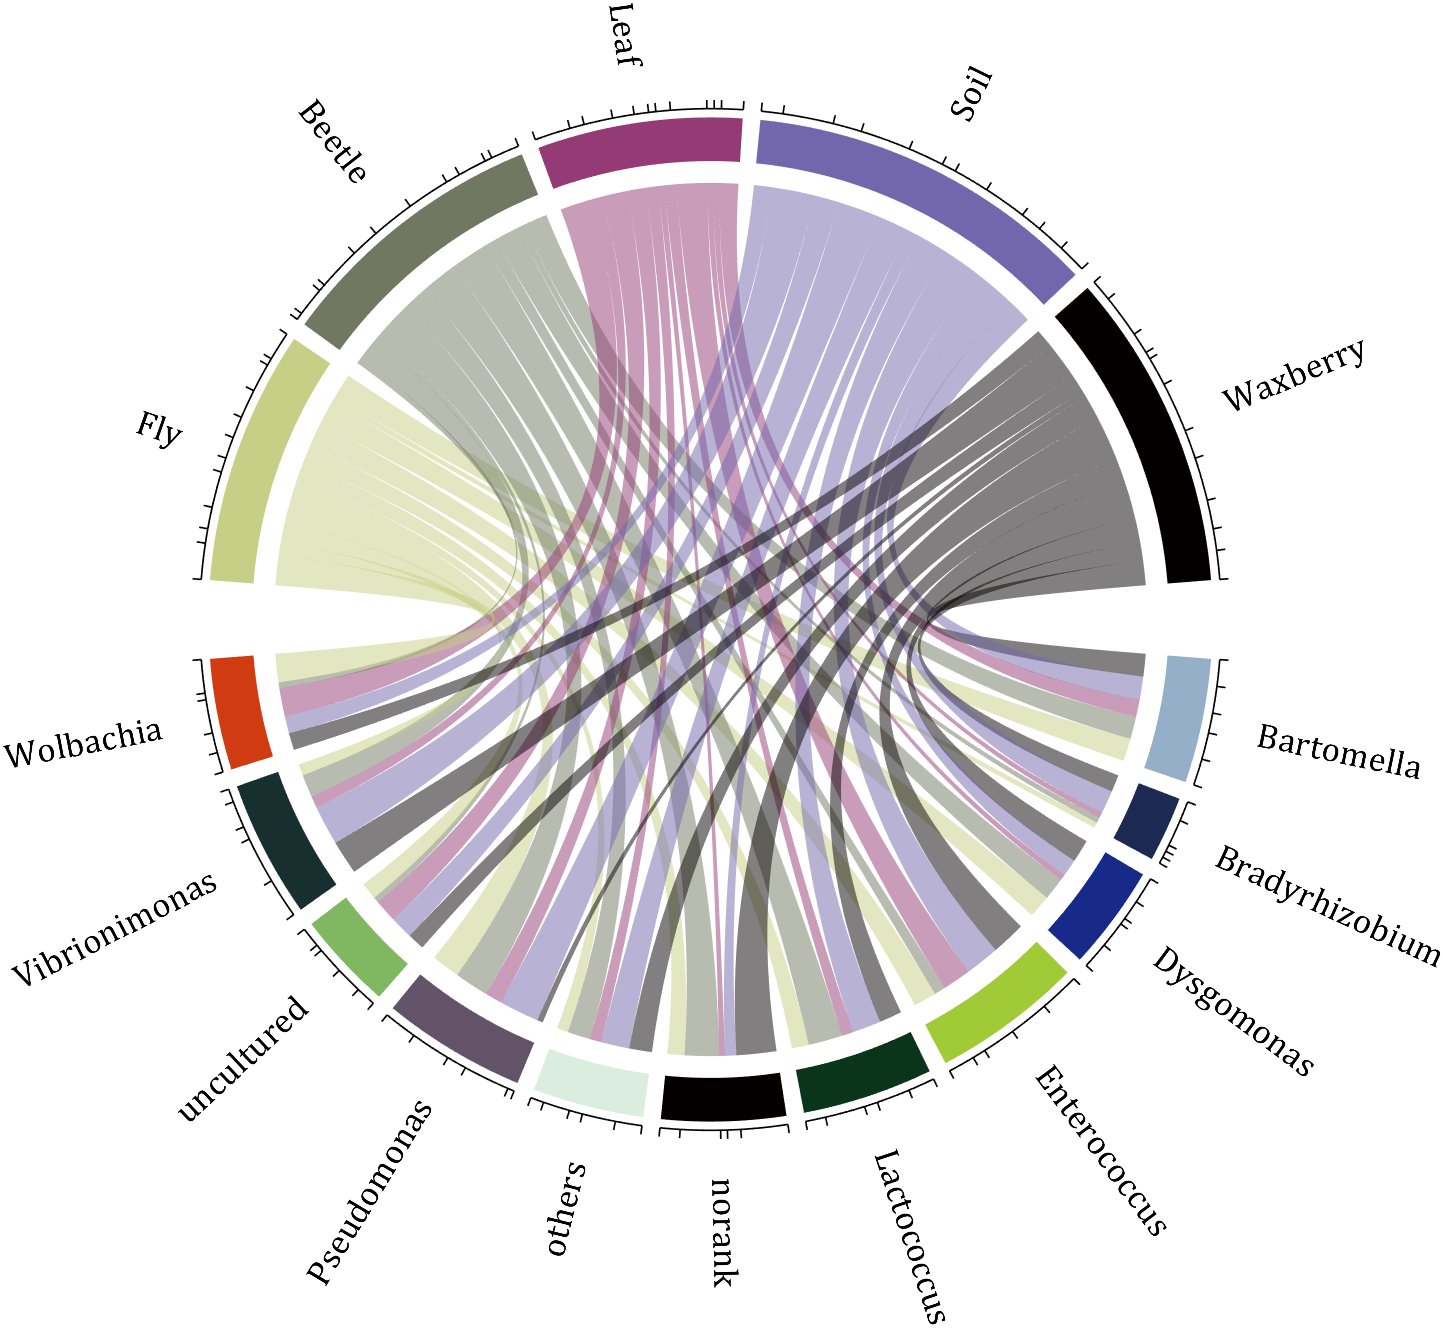
10 A Demo
rng(2)
dataMat=randi([1,7],[11,5]);
colName={'Fly','Beetle','Leaf','Soil','Waxberry'};
rowName={'Bartomella','Bradyrhizobium','Dysgomonas','Enterococcus',...
'Lactococcus','norank','others','Pseudomonas','uncultured',...
'Vibrionimonas','Wolbachia'};
CC=chordChart(dataMat,'rowName',rowName,'colName',colName,'Sep',1/80);
CC=CC.draw();
% 修改上方方块颜色(Modify the color of the blocks above)
CListT=[0.7765 0.8118 0.5216;0.4431 0.4706 0.3843;0.5804 0.2275 0.4549;
0.4471 0.4039 0.6745;0.0157 0 0 ];
for i=1:5
CC.setSquareT_N(i,'FaceColor',CListT(i,:))
end
% 修改下方方块颜色(Modify the color of the blocks below)
CListF=[0.5843 0.6863 0.7843;0.1098 0.1647 0.3255;0.0902 0.1608 0.5373;
0.6314 0.7961 0.2118;0.0392 0.2078 0.1059;0.0157 0 0 ;
0.8549 0.9294 0.8745;0.3882 0.3255 0.4078;0.5020 0.7216 0.3843;
0.0902 0.1843 0.1804;0.8196 0.2314 0.0706];
for i=1:11
CC.setSquareF_N(i,'FaceColor',CListF(i,:))
end
% 修改弦颜色(Modify chord color)
for i=1:5
for j=1:11
CC.setChordMN(j,i,'FaceColor',CListT(i,:),'FaceAlpha',.5)
end
end
CC.tickState('on')
CC.labelRotate('on')
CC.setFont('FontSize',17,'FontName','Cambria')
Hope to have your Reviews and Stars!!!
↓ ↓ ↓ ↓ ↓ ↓ ↓ ↓ ↓ ↓
↑ ↑ ↑ ↑ ↑ ↑ ↑ ↑ ↑ ↑
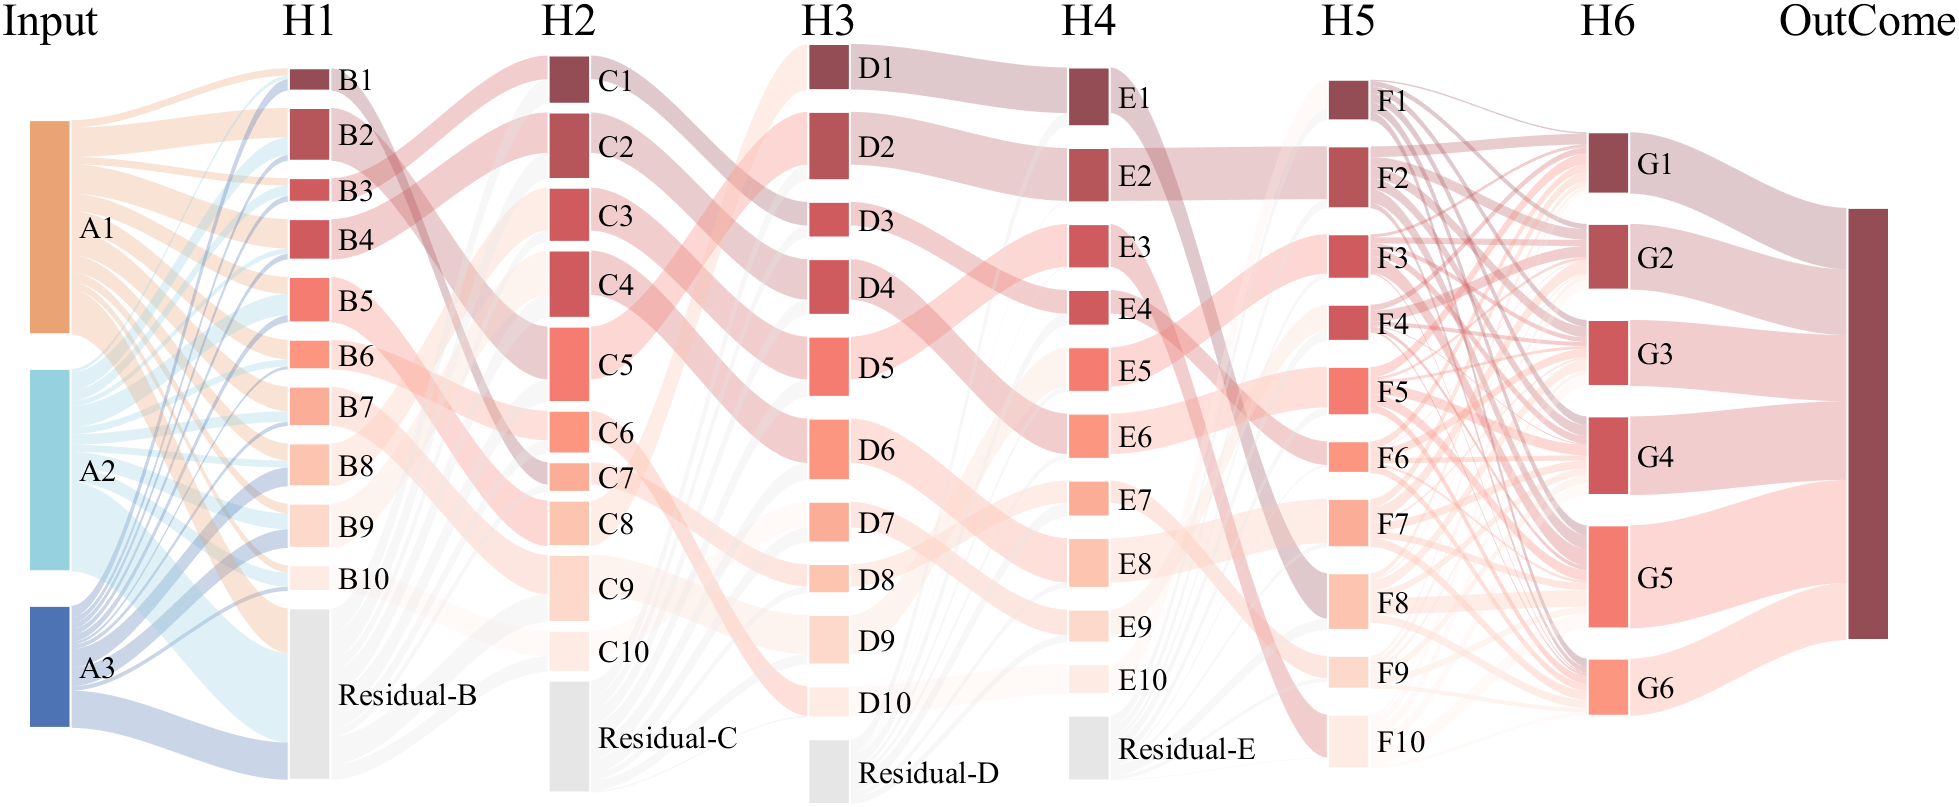
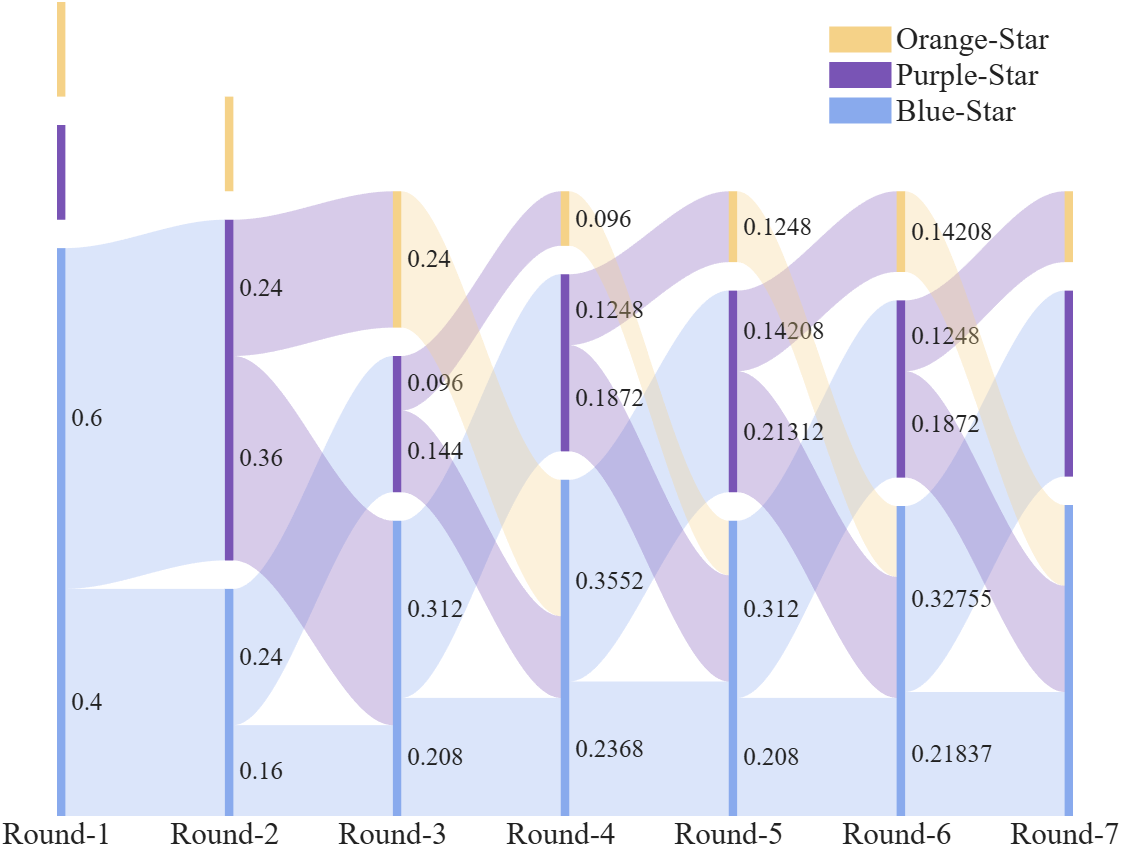
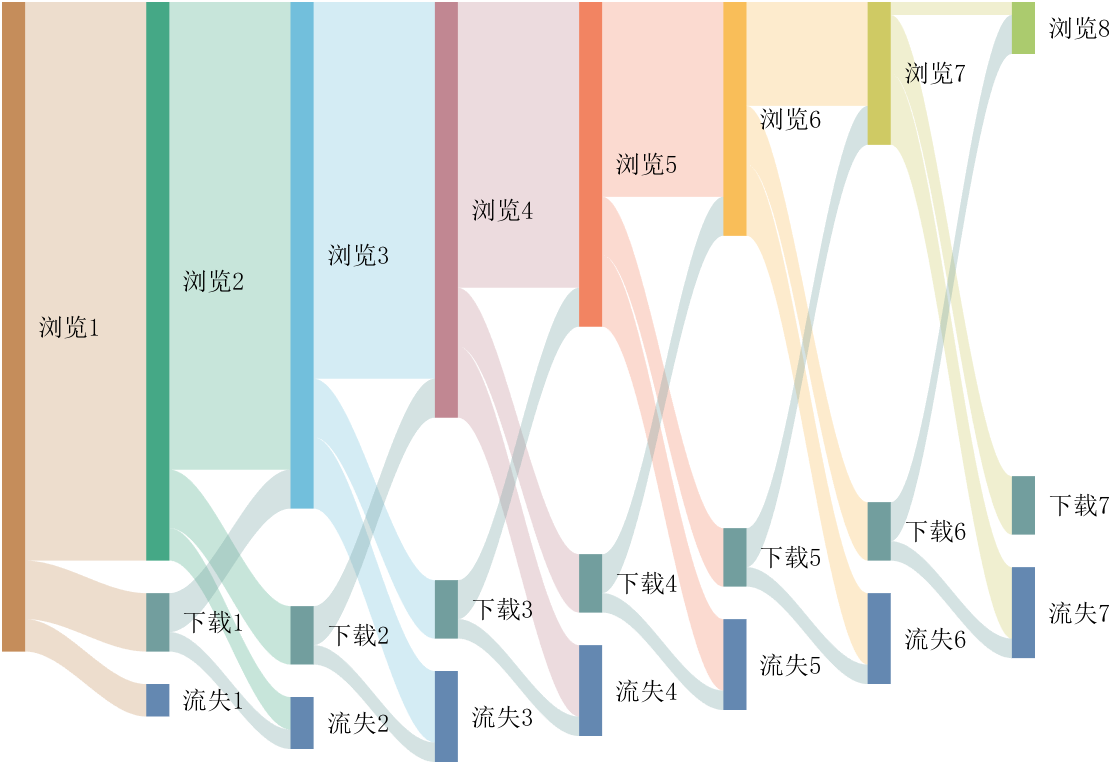
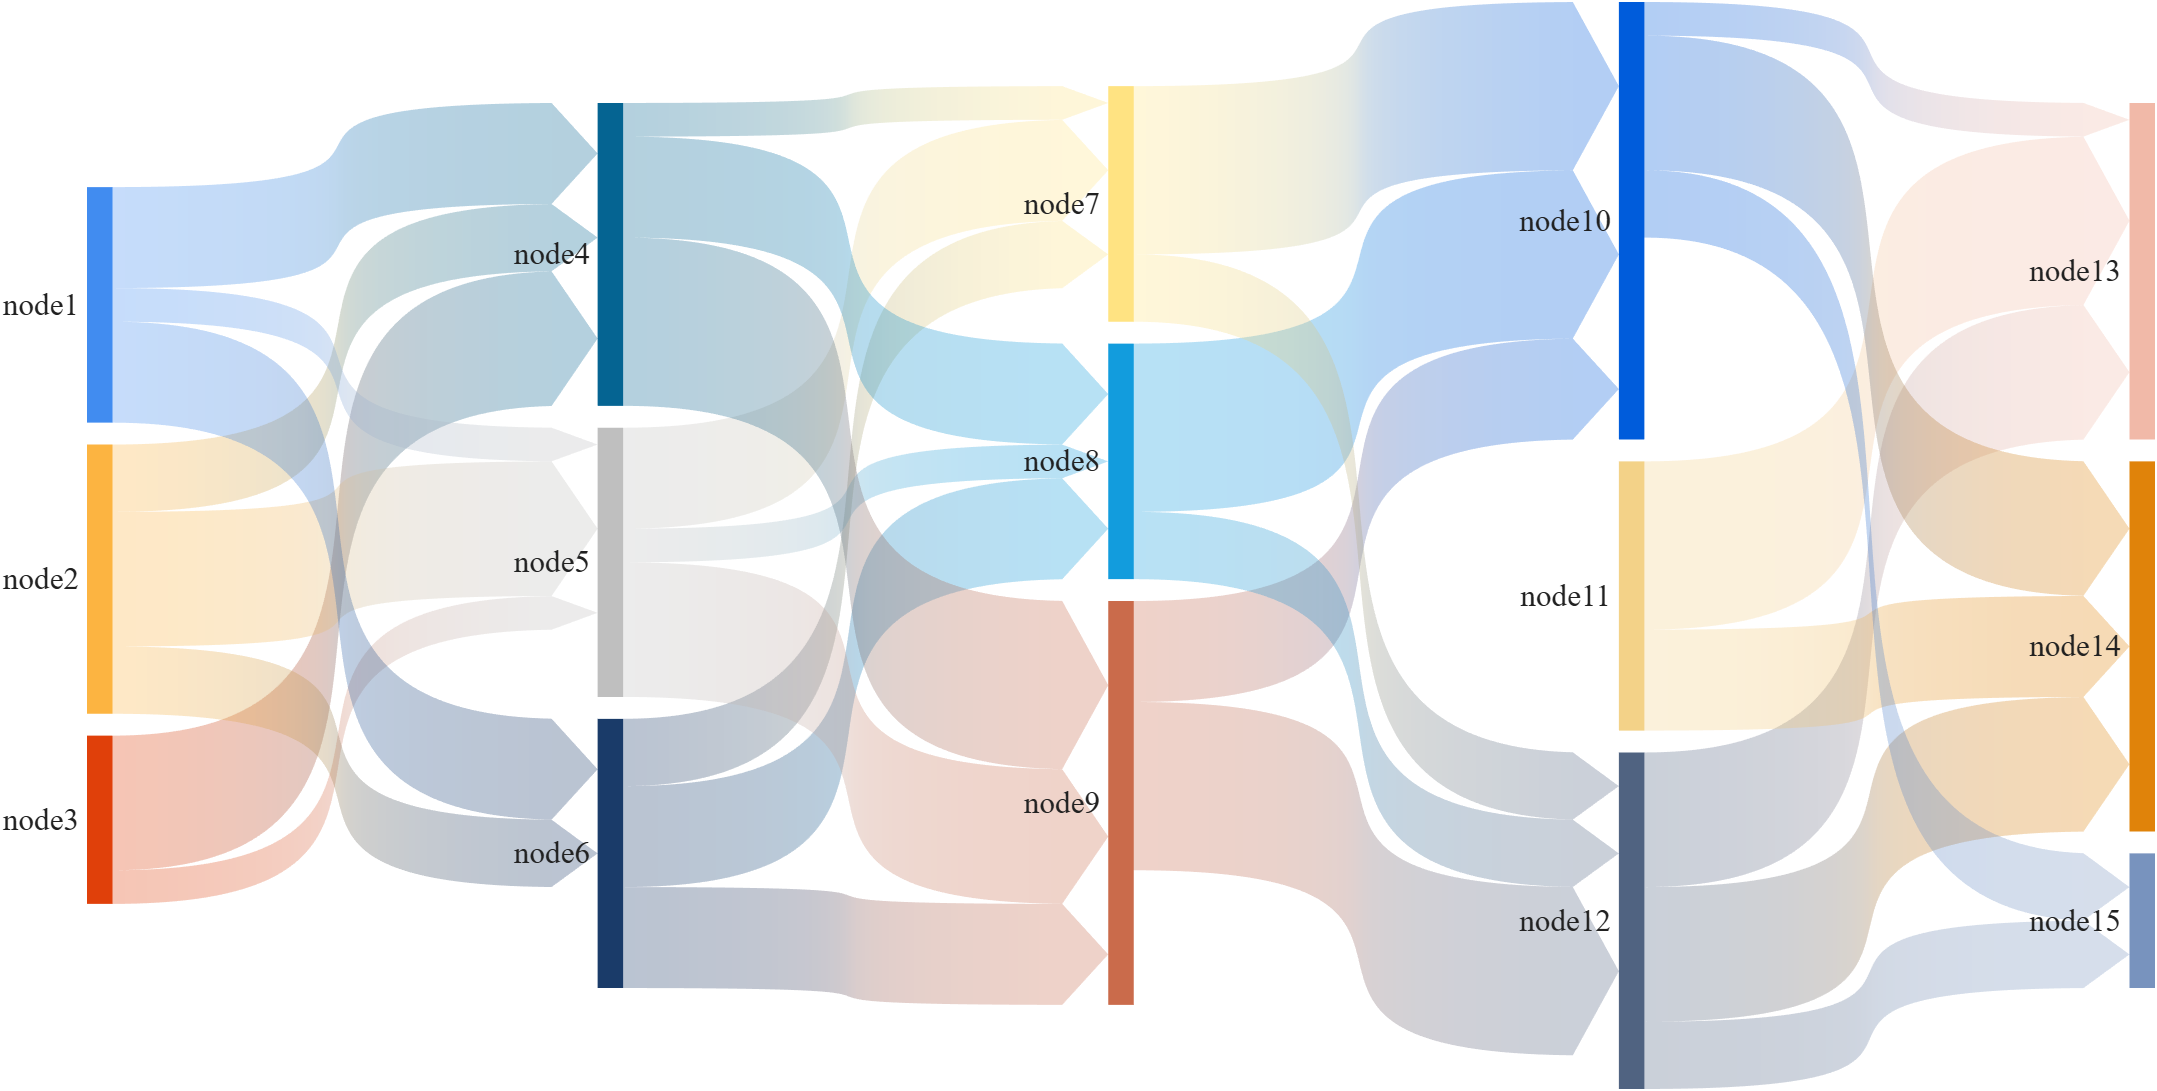
It is easy to obtain sankey plot like that using my tool:


New in R2022b: GridSizeChangedFcn
tiledlayout() creates a TiledChartLayout object that defines a gridded layout of axes within a figure. When using the 'flow' option, the grid size becomes dynamic and updates as axes are added or as the figure size changes. These features were introduced in R2019b and if you're still stuck on using subplot, you're missing out on several other great features of tiledlayout.
Starting in MATLAB R2022b you can define a callback function that responds to changes to the grid size in flow arrangements by setting the new gridSizeChangedFcn.
Use case
I often use a global legend to represent data across all axes within a figure. When the figure is tall and narrow, I want the legend to be horizontally oriented at the bottom of the figure but when the figure is short and wide, I prefer a vertically oriented legend on the right of the figure. By using the gridSizeChangedFcn, now I can update the legend location and orientation when the grid size changes.
Demo
gridSizeChangeFcn works like all other graphics callback functions. In this demo, I've named the gridSizeChangedFcn "updateLegendLayout", assigned by an anonymous function. The first input is the TiledChartLayout object and the second input is the event object that indicates the old and new grid sizes. The legend handle is also passed into the function. Since all of the tiles contain the same groups of data, the legend is based on data in the last tile.
As long as the legend is valid, the gridSizeChangedFcn updates the location and orientation of the legend so that when the grid is tall, the legend will be horizontal at the bottom of the figure and when the grid is wide, the legend will be vertical at the right of the figure.
Since the new grid size is available as a property in the TiledChartLayout object, I chose not to use the event argument. This way I can directly call the callback function at the end to update the legend without having to create an event.
Run this example from an m-file. Then change the width or height of the figure to demonstrate the legend adjustments.
% Prepare data
data1 = sort(randn(6))*10;
data2 = sort(randn(6))*10;
labels = ["A","B","C","D","E","F"];
groupLabels = categorical(["Control", "Test"]);
% Generate figure
fig = figure;
tcl = tiledlayout(fig, "flow", TileSpacing="compact", Padding="compact");
nTiles = height(data1);
h = gobjects(1,nTiles);
for i = 1:nTiles
ax = nexttile(tcl);
groupedData = [data1(i,:); data2(i,:)];
h = bar(ax,groupLabels, groupedData, "grouped");
title(ax,"condition " + i)
end
title(tcl,"GridSizeChangedFcn Demo")
ylabel(tcl,"Score")
legh = legend(h, labels);
title(legh,"Factors")
% Define and call the GridSizeChangeFcn
tcl.GridSizeChangedFcn = @(tclObj,event)updateLegendLayout(tclObj,event,legh);
updateLegendLayout(tcl,[],legh);
% Manually resize the vertical and horizontal dimensions of the figure
function updateLegendLayout(tclObj,~,legh)
% Evoked when the TiledChartLayout grid size changes in flow arrangements.
% tclObj - TiledChartLayout object
% event - (unused in this demo) contains old and new grid size
% legh - legend handle
if isgraphics(legh,'legend')
if tclObj.GridSize(1) > tclObj.GridSize(2)
legh.Layout.Tile = "south";
legh.Orientation = "horizontal";
else
legh.Layout.Tile = "east";
legh.Orientation = "vertical";
end
end
end
Give it a shot in MATLAB R2022b
- Replace the legend with a colorbar to update the location and orientation of the colorbar.
- Define a GridSizeChangedFcn within the loop so that it is called every time a tile is added.
- Create a figure with many tiles (~20) and dynamically set a color to each row of axes.
- Assign xlabels only to the bottom row of tiles and ylabels to only the left column of tiles.
Learn about other new features
This article is attached as a live script.