resubEdge
Resubstitution classification edge
Description
e = resubEdge(Mdl)e)
for the trained classification model Mdl using the predictor data
stored in Mdl.X, the corresponding true class labels stored in
Mdl.Y, and the observation weights stored in
Mdl.W.
e = resubEdge(Mdl,'IncludeInteractions',includeInteractions)
Examples
Load the ionosphere data set. This data set has 34 predictors and 351 binary responses for radar returns, either bad ('b') or good ('g').
load ionosphereTrain a support vector machine (SVM) classifier. Standardize the data and specify that 'g' is the positive class.
SVMModel = fitcsvm(X,Y,'Standardize',true,'ClassNames',{'b','g'});
SVMModel is a trained ClassificationSVM classifier.
Estimate the resubstitution edge, which is the mean of the training sample margins.
e = resubEdge(SVMModel)
e =
5.0997
The classifier edge measures the average of the classifier margins. One way to perform feature selection is to compare training sample edges from multiple models. Based solely on this criterion, the classifier with the highest edge is the best classifier.
Load the ionosphere data set. Remove the first two predictors for stability.
load ionosphere
X = X(:,3:end);
Define these two data sets:
fullXcontains all predictors.partXcontains the 10 most important predictors.
fullX = X;
idx = fscmrmr(X,Y);
partX = X(:,idx(1:10));
Train a naive Bayes classifier for each predictor set.
FullMdl = fitcnb(fullX,Y);
PartMdl = fitcnb(partX,Y);
FullMdl and PartMdl are trained ClassificationNaiveBayes classifiers.
Estimate the training sample edge for each classifier.
fullEdge = resubEdge(FullMdl)
fullEdge =
0.6554
partEdge = resubEdge(PartMdl)
partEdge =
0.7796
The edge of the classifier trained on the 10 most important predictors is larger. This result suggests that the classifier trained using only those predictors has a better in-sample fit.
Compare a generalized additive model (GAM) with linear terms to a GAM with both linear and interaction terms by examining the training sample margins and edge. Based solely on this comparison, the classifier with the highest margins and edge is the best model.
Load the 1994 census data stored in census1994.mat. The data set consists of demographic data from the US Census Bureau to predict whether an individual makes over $50,000 per year. The classification task is to fit a model that predicts the salary category of people given their age, working class, education level, marital status, race, and so on.
load census1994census1994 contains the training data set adultdata and the test data set adulttest. To reduce the running time for this example, subsample 500 training observations from adultdata by using the datasample function.
rng('default') % For reproducibility
NumSamples = 5e2;
adultdata = datasample(adultdata,NumSamples,'Replace',false);
Train a GAM that contains both linear and interaction terms for predictors. Specify to include all available interaction terms whose p-values are not greater than 0.05.
Mdl = fitcgam(adultdata,'salary','Interactions','all','MaxPValue',0.05)
Mdl =
  ClassificationGAM
           PredictorNames: {'age'  'workClass'  'fnlwgt'  'education'  'education_num'  'marital_status'  'occupation'  'relationship'  'race'  'sex'  'capital_gain'  'capital_loss'  'hours_per_week'  'native_country'}
             ResponseName: 'salary'
    CategoricalPredictors: [2 4 6 7 8 9 10 14]
               ClassNames: [<=50K    >50K]
           ScoreTransform: 'logit'
                Intercept: -28.5594
             Interactions: [82×2 double]
          NumObservations: 500


  Properties, Methods
Mdl is a ClassificationGAM model object. Mdl includes 82 interaction terms.
Estimate the training sample margins and edge for Mdl.
M = resubMargin(Mdl);
E = resubEdge(Mdl)
E =
1.0000
Estimate the training sample margins and edge for Mdl without including interaction terms.
M_nointeractions = resubMargin(Mdl,'IncludeInteractions',false);
E_nointeractions = resubEdge(Mdl,'IncludeInteractions',false)
E_nointeractions =
0.9516
Display the distributions of the margins using box plots.
boxplot([M M_nointeractions],'Labels',{'Linear and Interaction Terms','Linear Terms Only'})
title('Box Plots of Training Sample Margins')
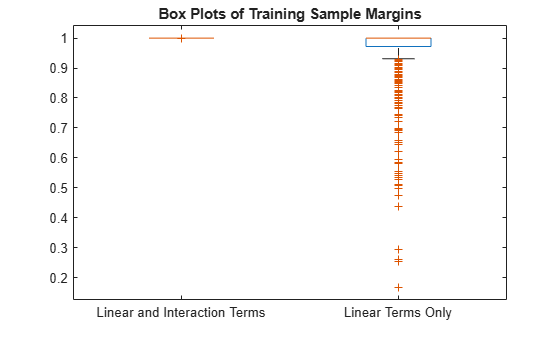
When you include the interaction terms in the computation, all the resubstitution margin values for Mdl are 1, and the resubstitution edge value (average of the margins) is 1. The margins and edge decrease when you do not include the interaction terms in Mdl.
Input Arguments
More About
Algorithms
resubEdge computes the classification edge according to the
corresponding edge function of the object (Mdl). For
a model-specific description, see the edge function reference pages in
the following table.
| Model | Classification Model Object (Mdl) | edge Object Function |
|---|---|---|
| Generalized additive model | ClassificationGAM | edge |
| k-nearest neighbor model | ClassificationKNN | edge |
| Naive Bayes model | ClassificationNaiveBayes | edge |
| Neural network model | ClassificationNeuralNetwork | edge |
| Support vector machine for one-class and binary classification | ClassificationSVM | edge |