주요 콘텐츠

signalTimeFrequencyFeatureExtractor

Streamline signal time-frequency feature extraction

Since R2024a

    The Transform property has changed. For more information, see Version History.

    Description

    Use a signalTimeFrequencyFeatureExtractor object to extract time-frequency features from a signal. You can use the extracted features to train a machine learning model or a deep learning network.

    Creation

    Description

    sFE = signalTimeFrequencyFeatureExtractor creates a signalTimeFrequencyFeatureExtractor object with default property values.

    sFE = signalTimeFrequencyFeatureExtractor(PropertyName=Value) sets property values of the signalTimeFrequencyFeatureExtractor object. For example,

    sFE = signalTimeFrequencyFeatureExtractor( ...
        FrameSize=30,SampleRate=10,SpectralKurtosis=true)
    creates a signalTimeFrequencyFeatureExtractor object that partitions a signal into frames of 30 samples each and a rate of 10 Hz to extract the spectral kurtosis feature from the spectrogram of each frame.

    example

    Properties

    expand all

    Main Properties

    Number of samples per frame, specified as a positive integer. The object divides the signal into frames of the specified length and extracts features for each frame. If you do not specify FrameSize, or if you specify FrameSize as empty, the object extracts features for the whole signal.

    Data Types: single | double

    Number of samples between the start of frames, specified as a positive integer. The frame rate determines the distance in samples between the starting points of frames. If you specify FrameRate, then you must also specify FrameSize. If you do not specify FrameRate or FrameOverlapLength, then the object assumes FrameRate to be equal to FrameSize.

    Note

    You cannot specify FrameRate and FrameOverlapLength simultaneously.

    Data Types: single | double

    Number of overlapping samples between consecutive frames, specified as a positive integer. FrameOverlapLength must be less than or equal to the frame size. If you specify FrameOverlapLength, then you must also specify FrameSize.

    Note

    You cannot specify FrameOverlapLength and FrameRate simultaneously.

    Data Types: single | double

    Input sample rate, specified as a positive scalar in hertz.

    If you do not specify SampleRate, the extract function of the object assumes the signal sampling rate as Hz.

    Data Types: single | double

    Rule to handle incomplete frames, specified as one of these:

    • "drop" — Drop the incomplete frame and do not use it to compute features.

    • "zeropad" — Zero-pad the incomplete frame and use it to compute features.

    This rule applies when the current frame size is less than the specified FrameSize property.

    Data Types: char | string

    Format of the signal features generated by the extract function, specified as one of these:

    • "matrix" — Columns correspond to feature values.

    • "table" — Each table variable corresponds to a feature value.

    Note

    You can generate features for multiple signals at once by specifying a datastore object input in the extract function. In this case, extract returns a cell array where each member corresponds to a feature matrix or table from a signal member of the datastore. The format of the generated features in each member follows the format specified in FeatureFormat.

    Data Types: char | string

    Time-frequency analysis methods to use for feature extraction, specified as a timeFrequencyFeatureTransformOptions object or a struct array.

    Note

    The Transform property will no longer support string scalars or character vectors in a future release. Instead, specify Transform as a timeFrequencyFeatureTransformOptions object or a struct array.

    The signalTimeFrequencyFeatureExtractor object uses the Transform property to determine which time-frequency representation to use to extract each feature.

    • To specify a timeFrequencyFeatureTransformOptions object or struct array, use name-value arguments consisting of a feature and its corresponding time-frequency analysis method. (since R2026a)

      Example:

      tfOpts = struct(TFRidges="synchrosqueezedscalogram",InstantaneousEnergy="vmd");
      tfFE = signalTimeFrequencyFeatureExtractor(Transform=tfOpts,TFRidges=true,InstantaneousEnergy=true);

    • If you specify this property as a struct array, signalTimeFrequencyFeatureExtractor converts it to an equivalent timeFrequencyFeatureTransformOptions object. (since R2026a)

    • If you do not specify this property, the signalTimeFrequencyFeatureExtractor object uses default time-frequency analysis methods.

    This table lists the time-frequency features that the signalTimeFrequencyFeatureExtractor object supports, along with the time-frequency analysis methods you can use to extract those features. For more information, see Analysis Methods for Time-Frequency Features.

    Features to ExtractTime-Frequency Analysis Methods
    SpectralKurtosis
    SpectralSkewness
    SpectralCrest
    SpectralFlatness
    SpectralEntropy
    TFRidges
    InstantaneousBandwidth
    "spectrogram" (default) |
    "synchrosqueezedspectrogram" | "synchrosqueezedscalogram"
    InstantaneousFrequency"spectrogram" (default) |
    "synchrosqueezedspectrogram" | "synchrosqueezedscalogram" |
    "emd" | "vmd" | "wavelet" | "waveletpacket"
    InstantaneousEnergy"emd" (default) | "vmd" | "wavelet" | "waveletpacket"
    MeanEnvelopeEnergy"emd"
    WaveletEntropy"wavelet" (default) | "waveletpacket"
    TimeSpectrum
    ScaleSpectrum
    "scalogram"

    Note

    • You cannot specify FrameSize, FrameRate, or FrameOverlapLength if both of these conditions occur:

      • You enable either of these features: InstantaneousFrequency, InstantaneousEnergy, or MeanEnvelopeEnergy.

      • You set either of these analysis methods: "emd" or "vmd".

    • You must have a Wavelet Toolbox™ license to extract features from the "scalogram", "synchrosqueezedscalogram", "wavelet", or "waveletpacket" analysis methods.

    Methods to convert feature vectors to scalar values, specified as a timeFrequencyScalarFeatureOptions object.

    You can specify methods to extract scalar values from Features to Extract. Specify scalarization methods for the feature extractor object by using the ScalarizationMethod name-value argument or the setScalarizationMethods function.

    • If you specify ScalarizationMethod, the signalTimeFrequencyFeatureExtractorobject returns the corresponding scalar values for each feature vector using the scalarization method.

      To convert a feature vector to scalar feature values:

      • You must enable the feature for extraction by setting the feature name in the signalTimeFrequencyFeatureExtractor object to true.

      • You must specify the desired scalarization methods for each feature name using a cell array of character vectors or a string array and store the information in a timeFrequencyScalarFeatureOptions object.

      After that, the extract function:

      • Extracts the vectors corresponding to each enabled feature.

      • Takes the list of scalarization methods compiled by the object and for each method computes the corresponding scalar value.

      • Concatenates the vector features and the scalar features.

    • If you do not specify ScalarizationMethod, the signalTimeFrequencyFeatureExtractor object does not perform any scalarization.

    For more information about scalarization methods, see Scalarization Methods for Time-Frequency Features.

    Features to Extract

    Extract signal features from its representation in the time-frequency domain. Specify the features to extract as name-value arguments featureName1=true,...,featureNameN=true, where featureName1, …, featureNameN are the feature names. The order of the arguments does not matter and you can specify them simultaneously with the Main Properties.

    Example: sFE = signalTimeFrequencyFeatureExtractor(InstantaneousEnergy=true,MeanEnvelopeEnergy=true) creates a time-frequency feature extractor object to extract the instantaneous energy and mean envelope energy from the empirical mode decomposition (EMD) transform of a signal.

    Option to extract the spectral kurtosis of the time-frequency signal representation, specified as true or false.

    If you specify this feature as true:

    • The feature extractor object enables this feature for extraction.

    • The extract function extracts this feature and concatenates it with all the other features that you enable in the feature extractor object.

    For more information about the spectral kurtosis feature, see spectralKurtosis.

    Data Types: logical

    Option to extract the spectral skewness of the time-frequency signal representation, specified as true or false.

    If you specify this feature as true:

    • The feature extractor object enables this feature for extraction.

    • The extract function extracts this feature and concatenates it with all the other features that you enable in the feature extractor object.

    For more information about the spectral skewness feature, see spectralSkewness.

    Data Types: logical

    Option to extract the spectral crest of the time-frequency signal representation, specified as true or false.

    If you specify this feature as true:

    • The feature extractor object enables this feature for extraction.

    • The extract function extracts this feature and concatenates it with all the other features that you enable in the feature extractor object.

    For more information about the spectral crest feature, see spectralCrest.

    Data Types: logical

    Option to extract the spectral flatness of the time-frequency signal representation, specified as true or false.

    If you specify this feature as true:

    • The feature extractor object enables this feature for extraction.

    • The extract function extracts this feature and concatenates it with all the other features that you enable in the feature extractor object.

    For more information about the spectral flatness feature, see spectralFlatness.

    Data Types: logical

    Option to extract the spectral entropy of the time-frequency signal representation, specified as true or false.

    If you specify this feature as true:

    • The feature extractor object enables this feature for extraction.

    • The extract function extracts this feature and concatenates it with all the other features that you enable in the feature extractor object.

    For more information about the spectral entropy feature, see spectralEntropy.

    Data Types: logical

    Option to extract the time-frequency ridges of the time-frequency signal representation, specified as true or false.

    If you specify this feature as true:

    • The feature extractor object enables this feature for extraction.

    • The extract function extracts this feature and concatenates it with all the other features that you enable in the feature extractor object.

    For more information about the time-frequency ridge feature, see tfridge.

    Data Types: logical

    Option to extract the instantaneous bandwidth of the time-frequency signal representation, specified as true or false.

    If you specify this feature as true:

    • The feature extractor object enables this feature for extraction.

    • The extract function extracts this feature and concatenates it with all the other features that you enable in the feature extractor object.

    For more information about the instantaneous bandwidth feature, see instbw.

    Data Types: logical

    Option to extract the instantaneous frequency of the time-frequency signal representation, specified as true or false.

    If you specify this feature as true:

    • The feature extractor object enables this feature for extraction.

    • The extract function extracts this feature and concatenates it with all the other features that you enable in the feature extractor object.

    For more information about the instantaneous frequency feature, see instfreq or hht.

    Data Types: logical

    Option to extract the instantaneous energy of the time-frequency signal representation, specified as true or false.

    If you specify this feature as true:

    • The feature extractor object enables this feature for extraction.

    • The extract function extracts this feature and concatenates it with all the other features that you enable in the feature extractor object.

    For more information about the instantaneous energy feature, see hht.

    Data Types: logical

    Option to extract the mean energy of the upper and lower envelopes for each intrinsic mode function (IMF) of the time-frequency signal representation, specified as true or false.

    If you specify this feature as true:

    • The feature extractor object enables this feature for extraction.

    • The extract function extracts this feature and concatenates it with all the other features that you enable in the feature extractor object.

    For more information about the mean-envelope energy feature, see emd.

    Data Types: logical

    Option to extract the wavelet entropy of the time-frequency signal representation, specified as true or false.

    If you specify this feature as true:

    • The feature extractor object enables this feature for extraction.

    • The extract function extracts this feature and concatenates it with all the other features that you enable in the feature extractor object.

    For more information about the wavelet entropy feature, see wentropy (Wavelet Toolbox).

    Data Types: logical

    Option to extract the time-averaged wavelet spectrum of the time-frequency signal representation, specified as true or false.

    If you specify this feature as true:

    • The feature extractor object enables this feature for extraction.

    • The extract function extracts this feature and concatenates it with all the other features that you enable in the feature extractor object.

    For more information about the time spectrum feature, see timeSpectrum (Wavelet Toolbox).

    Data Types: logical

    Option to extract the scale-averaged wavelet spectrum of the time-frequency signal representation, specified as true or false.

    If you specify this feature as true:

    • The feature extractor object enables this feature for extraction.

    • The extract function extracts this feature and concatenates it with all the other features that you enable in the feature extractor object.

    For more information about the scale spectrum feature, see scaleSpectrum (Wavelet Toolbox).

    Data Types: logical

    Object Functions

    extractExtract time-domain, frequency-domain, or time-frequency-domain features
    generateMATLABFunctionCreate MATLAB function compatible with C/C++ code generation
    getExtractorParametersGet current parameter values of feature extractor object
    getScalarizationMethodsGet scalarization methods for domain-specific signal features
    setExtractorParametersSet nondefault parameter values for feature extractor object
    setScalarizationMethodsSet scalarization methods for domain-specific signal features

    Examples

    collapse all

    Extract the spectral kurtosis and instantaneous frequency from the spectrogram of a quadratic-swept chirp signal.

    Generate a chirp with quadratic instantaneous frequency deviation. The chirp is sampled at 2π Hz for 60 seconds. The instantaneous frequency is 0.5 Hz at t = 0 and crosses 2 Hz at t = 60 seconds.

    fs = 2*pi;
    t = 0:1/fs:60;
    x = chirp(t,0.5,60,2,"quadratic");

    Create a signalTimeFrequencyFeatureExtractor object and enable the SpectralKurtosis and InstantaneousFrequency time-frequency-domain features.

    tfFE = signalTimeFrequencyFeatureExtractor( ...
        SpectralKurtosis=true,InstantaneousFrequency=true)
    tfFE = 
      signalTimeFrequencyFeatureExtractor with properties:
    
       Properties
                  FrameSize: []
                  FrameRate: []
                 SampleRate: []
        IncompleteFrameRule: "drop"
              FeatureFormat: "matrix"
                  Transform: [1×1 timeFrequencyFeatureTransformOptions]
        ScalarizationMethod: [1×1 timeFrequencyScalarFeatureOptions]
    
       Enabled Features
         SpectralKurtosis, InstantaneousFrequency
    
       Disabled Features
         SpectralSkewness, SpectralCrest, SpectralFlatness, SpectralEntropy, TFRidges, InstantaneousBandwidth
         MeanEnvelopeEnergy, InstantaneousEnergy, WaveletEntropy, TimeSpectrum, ScaleSpectrum


    Extract the features from the chirp signal. Reshape the result into the number of features extracted. Plot the features.

    features = extract(tfFE,x);
    
    featuresRows = reshape(features,[],2);
    stackedplot(featuresRows,"*",...
        DisplayLabels=["Spectral Kurtosis" "Instantaneous Frequency"])
    grid on

    Figure contains an object of type stackedplot.

    Set up a three-signal signalDatastore object and a signalTimeFrequencyFeatureExtractor object. Extract the spectral entropy and time-frequency ridges to the signals.

    Create a signalDatastore object with three oscillating signals sampled at 5000 Hz for three seconds.

    Fs = 5000;
    t = 0:1/Fs:3;
    members = {chirp(t,0,t(end),Fs/4); ...
            2*chirp(t,Fs/20,t(end),Fs/2,"quadratic",[],"convex"); ...
            vco(sin(2*pi*t),[0.1 0.4]*Fs,Fs)};
    sds = signalDatastore(members,SampleRate=Fs,OutputDataType="single");

    Create a signalTimeFrequencyFeatureExtractor object. Specify a sample rate. Enable the spectral entropy and time-frequency ridges as features to extract.

    tfFE = signalTimeFrequencyFeatureExtractor( ...
        SampleRate=Fs,SpectralEntropy=true,TFRidges=true);

    Set up the extractor parameters for a signalTimeFrequencyFeatureExtractor object. Specify the range between Fs/5 and Fs/2.5 to extract the spectral entropy. Set the penalty parameter to zero to extract the time-frequency ridges.

    setExtractorParameters(tfFE,"SpectralEntropy",Range=[Fs/5 Fs/2.5]);
    setExtractorParameters(tfFE,"TFRidges",Penalty=0);

    Extract and plot the time-frequency features for all the signals from a signalDatastore object.

    [features,infoFt] = extract(tfFE,sds);
    ftMatrix = cell2mat(features);
    
    spectralEntropy = ftMatrix(:,infoFt{1}.SpectralEntropySpectrogram);
    TFRidges = ftMatrix(:,infoFt{1}.TFRidgesSpectrogram);
    ftNames = ["Spectral Entropy" "Time-Frequency Ridges"];
    
    tiledlayout(numel(members),2)
    for id=1:numel(members)
        featureValues = {spectralEntropy(id,:) TFRidges(id,:)};
        for fid = 1:numel(ftNames)
            nexttile
            plot(featureValues{fid})
            title(ftNames(fid))
            subtitle("Signal " + id)
            axis tight
        end
    end

    Figure contains 6 axes objects. Axes object 1 with title Spectral Entropy contains an object of type line. Axes object 2 with title Time-Frequency Ridges contains an object of type line. Axes object 3 with title Spectral Entropy contains an object of type line. Axes object 4 with title Time-Frequency Ridges contains an object of type line. Axes object 5 with title Spectral Entropy contains an object of type line. Axes object 6 with title Time-Frequency Ridges contains an object of type line.

    Specify scalarization methods to extract the scalar impulse factor and peak value of the instantaneous energy feature for an oscillating signal.

    Set the impulse factor and the peak value as scalarization methods for the instantaneous energy time-frequency domain feature.

    opts = scalarFeatureOptions("timefrequency", ...
        InstantaneousEnergy={'ImpulseFactor';'PeakValue'})
    opts = 
      timeFrequencyScalarFeatureOptions with properties:
    
              SpectralKurtosis: [0×0 string]
              SpectralSkewness: [0×0 string]
                 SpectralCrest: [0×0 string]
              SpectralFlatness: [0×0 string]
               SpectralEntropy: [0×0 string]
                      TFRidges: [0×0 string]
        InstantaneousBandwidth: [0×0 string]
        InstantaneousFrequency: [0×0 string]
           InstantaneousEnergy: [2×1 string]
            MeanEnvelopeEnergy: [0×0 string]
                  TimeSpectrum: [0×0 string]
                WaveletEntropy: [0×0 string]
                 ScaleSpectrum: [0×0 string]
                           All: [0×0 string]


    Create a signalTimeFrequencyFeatureExtractor object that returns scalar values for the instantaneous energy feature from the variational mode decomposition of a signal.

    tfFE = signalTimeFrequencyFeatureExtractor( ...
        Transform=struct("InstantaneousEnergy","vmd"), ...
        InstantaneousEnergy=true,ScalarizationMethod=opts);

    Extract the vector and scalar features for a voltage-controlled oscillating signal.

    fs = 10000;
    t = 0:1/fs:2;
    x = vco(sawtooth(2*pi*t,0.75),[0.1 0.4]*fs,fs);
    [features,info] = extract(tfFE,x);

    Display the scalar feature values.

    % Impulse Factor of the Instantaneous Energy Vector
    features(info.InstantaneousEnergyVMDImpulseFactor)
    ans = 
    8.7551
    
    % Peak Value of the Instantaneous Energy Vector
    features(info.InstantaneousEnergyVMDPeakValue)
    ans = 
    1.3385
    

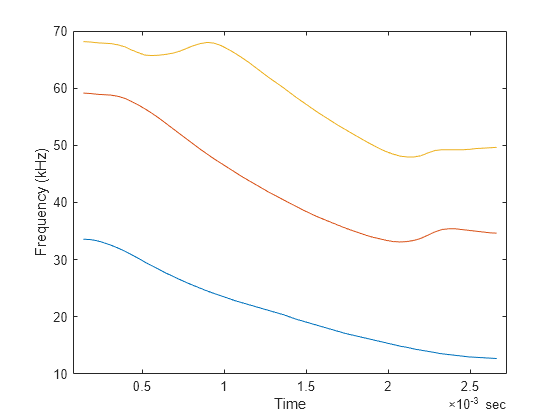
    Extract the time-frequency ridges from a spectrogram using a signalTimeFrequencyFeatureExtractor object.

    Load a data file containing an echolocation pulse batsignal, emitted by a big brown bat (Eptesicus fuscus) and measured with a sample rate DT of 7 microseconds. For more information, see the example Find and Track Ridges Using Reassigned Spectrogram. Thanks to Curtis Condon, Ken White, and Al Feng of the Beckman Center at the University of Illinois for the bat data and permission to use it in this example.

    load batsignal

    Create a MATLAB® timetable using the signal and the time information.

    t = (0:length(batsignal)-1)*DT;
    sg = timetable(seconds(t)',batsignal);

    Create an object to extract time-frequency ridges from the spectrogram of a signal.

    Fs = 1/DT;
    sfe = signalTimeFrequencyFeatureExtractor(SampleRate=Fs,TFRidges=true);

    Set the leakage, the time resolution, and the overlap percent parameters for the spectrogram analysis method.

    lk = 0.9;
    tRes = 0.00028; % seconds
    oPer = 85;
    
    setExtractorParameters(sfe,"spectrogram", ...
        Leakage=lk,TimeResolution=tRes,OverlapPercent=oPer);

    Set the number of ridges, number of frequency bins, and penalty parameters for the time-frequency ridges feature.

    nRidges = 3;
    
    setExtractorParameters(sfe,"TFRidges", ...
      NumRidges=nRidges,NumFrequencyBins=128,Penalty=0.01);

    Extract and plot the time-frequency ridges.

    tfRidges = reshape(extract(sfe,sg),[],nRidges);
    
    tStamps = seconds(tRes/2+(1-oPer/100)*tRes*(0:length(tfRidges)-1));
    plot(tStamps,tfRidges/1000)
    xlabel("Time")
    ylabel("Frequency (kHz)")

    Figure contains an axes object. The axes object with xlabel Time, ylabel Frequency (kHz) contains 3 objects of type line.

    Extract the instantaneous frequency of a signal using the wavelet synchrosqueezed transform (WSST), the time-averaged wavelet spectrum using the continuous wavelet transform (CWT), and the wavelet entropy using the maximal overlap discrete wavelet transform (MODWT).

    Load an ECG signal corresponding to record 200 of the MIT-BIH Arrhythmia Database [1]. The workspace variable ecgsig contains the signal, and the variable tm contains the sample times. The sample rate is approximately 400 Hz.

    load mit200
    Fs = 400;

    The signal has 10,000 samples. Reshape the signal into a 1000-by-10 matrix. Each column represents one channel in a multichannel signal. Create a signalDatastore object from the matrix.

    ecgsig = reshape(ecgsig,[],10);
    ecgsig = num2cell(ecgsig,1);
    sds = signalDatastore(ecgsig,SampleRate=Fs);

    Set the mean and standard deviation as scalarization methods for the wavelet entropy feature.

    opts = scalarFeatureOptions("timefrequency", ...
        WaveletEntropy=["Mean" "StandardDeviation"]);

    Create a signalTimeFrequencyFeatureExtractor object that returns:

    • Wavelet entropy and the scalar values specified in opts

    • Instantaneous frequency from a WSST

    • Time-averaged spectrum from a CWT

    You can extract instantaneous frequency from a time-frequency signal representation created using methods such as the short-time Fourier transform ("spectrogram"), empirical mode decomposition ("emd"), and the maximal overlap discrete wavelet packet transform ("waveletpacket"). Set the time-frequency analysis method for the instantaneous frequency feature to "synchrosqueezedscalogram". The CWT is the only analysis method you can use to extract the time-averaged wavelet spectrum. The signalTimeFrequencyFeatureExtractor object uses the MODWT, the default analysis method of the wentropy function, to extract the wavelet entropy.

    tf = timeFrequencyFeatureTransformOptions( ...
        "InstantaneousFrequency","synchrosqueezedscalogram");
    tfFE = signalTimeFrequencyFeatureExtractor( ...
        SampleRate=Fs, ...
        Transform=tf, ...
        InstantaneousFrequency=true, ...
        WaveletEntropy=true, ...
        TimeSpectrum=true, ...
        ScalarizationMethod=opts);

    Extract the features from all the signals.

    data = read(sds);
    [features,info] = extract(tfFE,sds);
    ftMatrix = cell2mat(features);
    
    instFrq = ftMatrix(:,info{1}.InstantaneousFrequencySynchroSqueezedScalogram);
    timeSpect = ftMatrix(:,info{1}.TimeSpectrumScalogram);
    waveEnt = ftMatrix(:,info{1}.WaveletEntropyWavelet);
    waveEntMean = ftMatrix(:,info{1}.WaveletEntropyWaveletMean);
    waveEntStd = ftMatrix(:,info{1}.WaveletEntropyWaveletStandardDeviation);

    For each signal, compute the mean and standard deviation directly from the extracted wavelet entropy. Confirm they are equal to the extracted scalar values.

    [mean(waveEnt,2) waveEntMean]
    ans = 10×2
    
        0.7675    0.7675
        0.7941    0.7941
        0.7533    0.7533
        0.7465    0.7465
        0.8055    0.8055
        0.8141    0.8141
        0.8048    0.8048
        0.7833    0.7833
        0.7999    0.7999
        0.7910    0.7910
    
    
    [std(waveEnt,0,2) waveEntStd]
    ans = 10×2
    
        0.1714    0.1714
        0.1258    0.1258
        0.2063    0.2063
        0.1945    0.1945
        0.1367    0.1367
        0.1123    0.1123
        0.1235    0.1235
        0.1228    0.1228
        0.1123    0.1123
        0.1168    0.1168


    Display the time-averaged wavelet spectrum of the signals as a waterfall plot.

    waterfall(timeSpect)
    title("Time-Averaged Wavelet Spectrum")
    xlabel("Frequency Index")
    ylabel("Channel Index")
    zlabel("Power")

    Figure contains an axes object. The axes object with title Time-Averaged Wavelet Spectrum, xlabel Frequency Index, ylabel Channel Index contains an object of type patch.

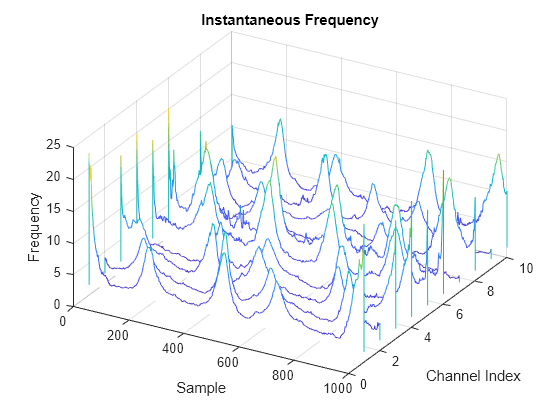
    Display the instantaneous frequency of the signals as a waterfall plot.

    waterfall(instFrq)
    view(30,40)
    title("Instantaneous Frequency")
    xlabel("Sample")
    ylabel("Channel Index")
    zlabel("Frequency")

    Figure contains an axes object. The axes object with title Instantaneous Frequency, xlabel Sample, ylabel Channel Index contains an object of type patch.

    Since R2025a

    Extract time-domain, frequency-domain, and time-frequency features from healthy bearing vibration signals and faulty bearing vibration signals. While a healthy bearing vibration signal does not have outstanding defects, a faulty bearing vibration signal results from wear-and-tear defects, such as spalls on the gear teeth, eccentricity or gear misalignment, and cracks at the races.

    For more information on bearing signal generation and analysis, see Vibration Analysis of Rotating Machinery. To learn more about the feature extraction and model training workflow to identify faulty bearing signals in mechanical systems, see Machine Learning and Deep Learning Classification Using Signal Feature Extraction Objects.

    Generate Healthy Bearing Signal

    Generate a healthy bearing vibration signal as a sum of three cosine pulses with amplitudes of 0.4 V, 0.2 V, and 1 V, respectively, and frequencies of 22.5 Hz, 8.36 Hz, and 292.5 Hz, respectively, for three seconds and with a sample rate of 20 kHz. Generate Gaussian noise and add it to the signal.

    rng("default")
    Fs = 20e3;
    t = (0:1/Fs:3-1/Fs)';
    
    a = [0.4 0.2 1];
    f = [22.5 8.36 292.5];
    sClean = cos(2*pi*f.*t)*a';
    sHealthy = sClean + 0.2*randn(size(t));

    Generate Faulty Bearing Signal

    Generate a faulty bearing vibration signal by adding a bearing impact signal to the healthy bearing signal. Model each impact as a 3 kHz sinusoid windowed by a Kaiser window. The defect causes a series of 10-millisecond impacts on the bearing.

    tImpact = t(t<10e-3)';
    xImpact = sin(2*pi*3000*tImpact).*kaiser(length(tImpact),40)';
    
    xImpactBper = 0.33*pulstran(t,0:1/104.5:t(end),xImpact,Fs);

    Generate a faulty bearing vibration signal using the healthy bearing signal and the bearing impact signal.

    sFaulty = sHealthy + xImpactBper;

    Consolidate and Visualize Signals

    Bundle the healthy bearing and faulty bearing signals in a signalDatastore object in single precision.

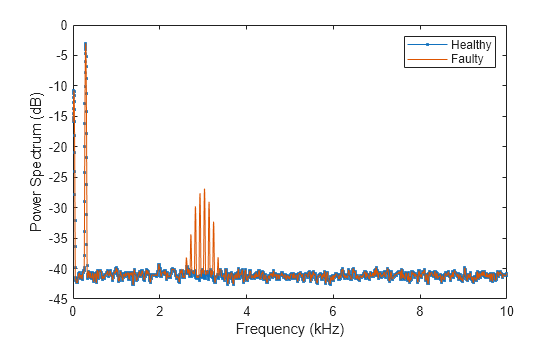
    sds = signalDatastore({sHealthy,sFaulty},OutputDataType="single");

    Plot the power spectrum of the healthy and faulty vibration signals. Observe the peaks that correspond to the bearing impact.

    [P,F] = pspectrum([sHealthy sFaulty],Fs);
    p = plot(F/1000,pow2db(P));
    p(1).Marker = ".";
    xlabel("Frequency (kHz)")
    ylabel("Power Spectrum (dB)")
    legend(["Healthy" "Faulty"])

    Figure contains an axes object. The axes object with xlabel Frequency (kHz), ylabel Power Spectrum (dB) contains 2 objects of type line. These objects represent Healthy, Faulty.

    Set Up Feature Extraction Pipeline

    Create a signalTimeFeatureExtractor object for time-domain feature extraction.

    timeFE = signalTimeFeatureExtractor(SampleRate=Fs,...
        RMS=true,ImpulseFactor=true,StandardDeviation=true);

    Create a signalFrequencyFeatureExtractor object for frequency-domain feature extraction.

    freqFE = signalFrequencyFeatureExtractor(SampleRate=Fs, ...
        MedianFrequency=true,BandPower=true,PeakAmplitude=true);

    Create a signalTimeFrequencyFeatureExtractor object to extract time-frequency features from a spectrogram. Set the leakage parameter for the spectrogram to 90%.

    timeFreqFE = signalTimeFrequencyFeatureExtractor(SampleRate=Fs, ...
        SpectralKurtosis=true,SpectralSkewness=true,TFRidges=true);
    
    setExtractorParameters(timeFreqFE,"spectrogram",Leakage=0.9);

    Extract Multidomain Features

    Extract signal features using all three feature extractors for the signals in the signalDatastore object sds. Concatenate the multidomain features. Display the first four columns in a feature table.

    featureCell = cellfun(@(a,b,c) [real(a) real(b) real(c)], ...
        extract(timeFE,sds),extract(freqFE,sds),extract(timeFreqFE,sds), ...
        UniformOutput=false);
    
    featureMatrix = cell2mat(featureCell);
    featureTable = array2table(featureMatrix);
    head(featureTable(:,1:4))
        featureMatrix1    featureMatrix2    featureMatrix3    featureMatrix4
        ______________    ______________    ______________    ______________
    
           0.80115           0.80116            3.2635            292.39    
           0.80538           0.80539            3.1501            292.41    
    

    More About

    expand all

    Algorithms

    expand all

    Assume that you are extracting time-frequency features from an input signal x sampled at a rate Fs. When you specify signal framing properties (FrameSize, FrameRate or FrameOverlapLength, and IncompleteFrameRule), the feature extractor sets up the signal partitioning operation for x to extract features for each frame.

    This table shows the equivalent syntaxes that signalTimeFrequencyFeatureExtractor uses to partition the signal x into frames of size fl, frame rate fr or frame overlap length ol, and incomplete frame rule ifr. If you do not specify signal framing properties, signalTimeFrequencyFeatureExtractor considers x as a single-framed signal.

    Frame SpecificationsFeature Extractor Object SpecificationSignal Framing Operation Equivalency


    FrameSize
    FrameRate
    IncompleteFrameRule

    sFE = signalTimeFrequencyFeatureExtractor( ... 
        FrameSize=fl,FrameRate=fr, ...
        IncompleteFrameRule=ifr);
    xFrames = framesig(x,fl, ...
        OverlapLength=fl-fr, ...
        IncompleteFrameRule=ifr);


    FrameSize
    FrameOverlapLength
    IncompleteFrameRule

    sFE = signalTimeFrequencyFeatureExtractor( ... 
        FrameSize=fl,FrameOverlapLength=ol, ...
        IncompleteFrameRule=ifr);
    xFrames = framesig(x,fl, ...
        OverlapLength=ol, ...
        IncompleteFrameRule=ifr);

    These sections list the features that a signalTimeFrequencyFeatureExtractor object supports for each time-frequency analysis method and compares the syntax equivalency with individual feature extractor functions.

    Note

    To obtain the equivalent syntax for the feature extraction setup based on the properties specified when you create the signalTimeFrequencyFeatureExtractor object, use generateMATLABFunction.

    References

    [1] Moody, G.B., and R.G. Mark. “The Impact of the MIT-BIH Arrhythmia Database.” IEEE Engineering in Medicine and Biology Magazine 20, no. 3 (June 2001): 45–50. https://doi.org/10.1109/51.932724.

    Extended Capabilities

    expand all

    Version History

    Introduced in R2024a

    expand all