시각화 및 해석 가능성
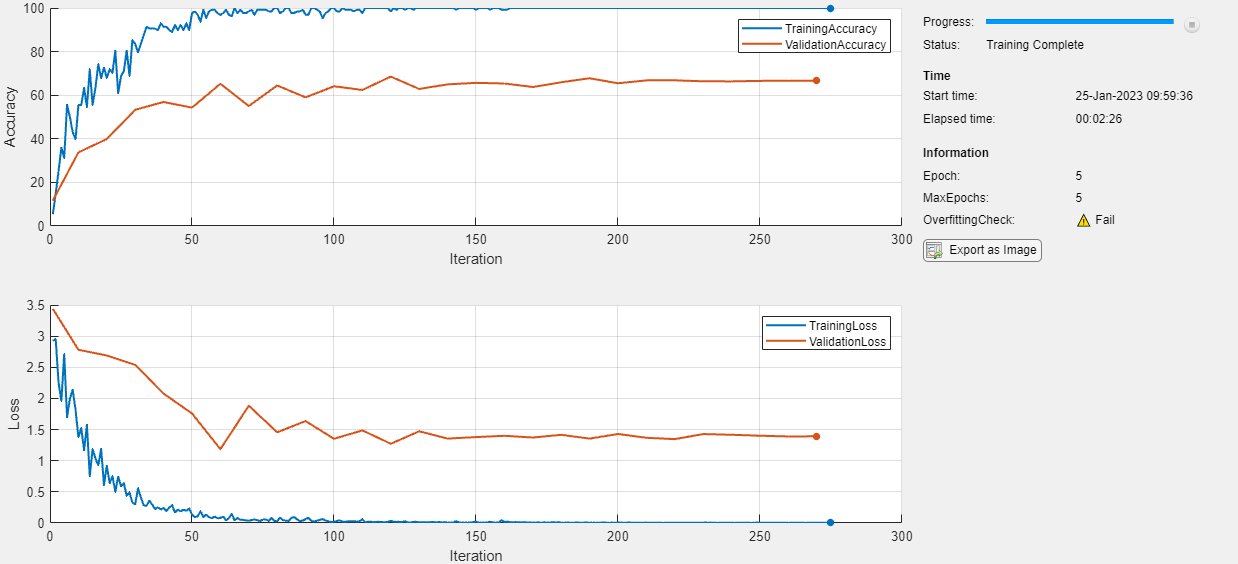
훈련 진행 상황 플로팅, 정확도 평가, 예측 설명 및 신경망이 학습한 특징 시각화
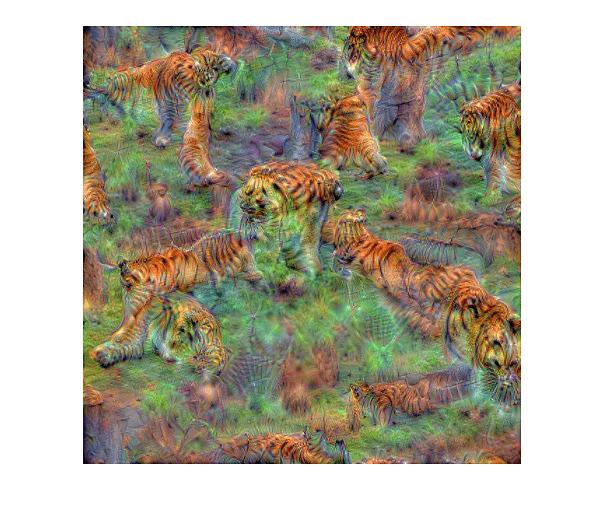
신경망의 정확도와 손실을 표현하는 내장 플롯을 사용하여 훈련 진행 상황을 모니터링합니다. Grad-CAM, 가림(occlusion) 민감도, LIME, 딥 드림 같은 시각화 기법을 사용하여 훈련된 신경망을 조사합니다.
딥러닝 시각화 방법
앱
| 심층 신경망 디자이너 | 딥러닝 신경망을 설계하고 시각화합니다 |
객체
trainingProgressMonitor | Monitor and plot training progress for deep learning custom training loops (R2022b 이후) |
함수
속성
| ConfusionMatrixChart Properties | Confusion matrix chart appearance and behavior |
| ROCCurve Properties | Receiver operating characteristic (ROC) curve appearance and behavior (R2022b 이후) |
도움말 항목
훈련 진행 상황 및 성능
- 딥러닝 훈련 진행 상황 모니터링하기
이 예제에서는 딥러닝 신경망의 훈련 진행 상황을 모니터링하는 방법을 보여줍니다. - Monitor Custom Training Loop Progress
Track and plot custom training loop progress. - Monitor GAN Training Progress and Identify Common Failure Modes
Learn how to diagnose and fix some of the most common failure modes in GAN training. - ROC Curve and Performance Metrics
Userocmetricsto examine the performance of a classification algorithm on a test data set. - Compare Deep Learning Models Using ROC Curves
This example shows how to use receiver operating characteristic (ROC) curves to compare the performance of deep learning models. - Define Custom Metric Function
Define custom deep learning metrics using functions. - Define Custom Deep Learning Metric Object
Learn how to define custom deep learning metrics using custom classes. - Define Custom Metric Object
This example shows how to define a custom metric for deep learning tasks. - Deep Learning Metrics
Comparison of metrics for deep learning tasks.
해석 가능성
- Explore Network Predictions Using Deep Learning Visualization Techniques
This example shows how to investigate network predictions using deep learning visualization techniques. - Understand Network Predictions Using Occlusion
This example shows how to use occlusion sensitivity maps to understand why a deep neural network makes a classification decision. - Interpret Deep Network Predictions on Tabular Data Using LIME
This example shows how to use the locally interpretable model-agnostic explanations (LIME) technique to understand the predictions of a deep neural network classifying tabular data. - Investigate Spectrogram Classifications Using LIME
This example shows how to use locally interpretable model-agnostic explanations (LIME) to investigate the robustness of a deep convolutional neural network trained to classify spectrograms. - Investigate Classification Decisions Using Gradient Attribution Techniques
This example shows how to use gradient attribution maps to investigate which parts of an image are most important for classification decisions made by a deep neural network. - Investigate Network Predictions Using Class Activation Mapping
This example shows how to use class activation mapping (CAM) to investigate and explain the predictions of a deep convolutional neural network for image classification. - Visualize Image Classifications Using Maximal and Minimal Activating Images
This example shows how to use a data set to find out what activates the channels of a deep neural network. - View Network Behavior Using tsne
This example shows how to use thetsnefunction to view activations in a trained network. - LSTM 신경망의 활성화 시각화
이 예제에서는 활성화를 추출하여 LSTM 신경망에서 학습한 특징을 검사하고 시각화하는 방법을 보여줍니다. - 컨벌루션 신경망의 활성화 시각화하기
이 예제에서는 컨벌루션 신경망에 영상을 입력하고 신경망의 여러 계층의 활성화 결과를 표시하는 방법을 보여줍니다. - 컨벌루션 신경망의 특징 시각화하기
이 예제에서는 컨벌루션 신경망이 학습한 특징을 시각화하는 방법을 보여줍니다. - Deep Learning Visualization Methods
Learn about and compare deep learning visualization methods.


