등가단면으로 시각화에 맥락 더하기
등가단면이란?
등가단면은 등가곡면에 대한 시각적 맥락을 제공하기 위해 등가곡면의 제한에 맞춰진 평면입니다. 등가단면은 등가단면이 단면을 제공하는 등가곡면 내부의 단면의 시점을 보여줍니다.
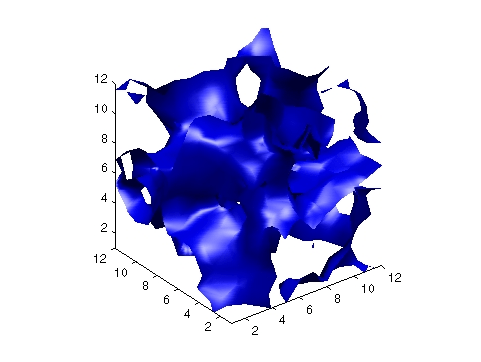
다음 두 그림은 등가단면의 사용 예를 보여줍니다. 첫 번째 그림은 등가단면이 없는 등가곡면입니다.

두 번째 그림은 동일한 등가곡면에 등가단면을 추가한 효과를 보여줍니다.

기타 등가단면의 응용 사례
다음 예에 등가단면의 추가적인 응용 사례가 나와 있습니다.
등가단면 정의하기
등가곡면과 같이 등가단면은 patch 그래픽스 객체로 생성됩니다. isocaps 명령을 사용하여 patch에 전달할 데이터를 생성합니다. 예를 들어, 다음은
patch(isocaps(voldata,isoval),...
   'FaceColor','interp',...
...'EdgeColor','none')
값 isoval에서 스칼라 볼륨 데이터 voldata에 대한 등가단면을 생성합니다. 사용자는 등가단면의 가장자리가 등가곡면에 맞도록 동일한 볼륨 데이터와 등가값을 사용하여 등가곡면을 생성해야 합니다.
패치의 FaceColor 속성을 interp로 설정하면 등가단면으로 범위가 정해지는 데이터 값을 컬러맵의 요소에 매핑하는 채색 결과를 얻을 수 있습니다. 등가단면에 대한 조명과 채색 효과를 제어하는 다른 patch 속성을 설정할 수도 있습니다.
등가곡면에 등가단면 추가하기
이 예제에서는 등가단면을 사용할 때 채색 특성과 조명 특성을 설정하는 방법을 설명합니다. 다음 5가지 기본 단계가 있습니다.
1. 데이터 준비하기
이 예제에서는 난수(rand) 데이터로 구성된 3차원 배열을 사용하여 볼륨 데이터를 정의합니다. 그런 다음 데이터를 평활화합니다(smooth3).
data = rand(12,12,12);
data = smooth3(data,'box',5);
2. 등가곡면을 만들고 속성 설정하기
isosurface와 patch를 사용하여 등가곡면을 만들고 채색 속성과 조명 속성을 설정합니다. 더욱 균일한 조명을 제공하기 위해 사용되는 두 광원의 밝기를 보상할 수 있도록 반사광의 AmbientStrength, SpecularStrength, DiffuseStrength를 줄이십시오.
등가곡면의 꼭짓점 법선을 다시 계산하여 더 부드러운 조명을 생성합니다(isonormals).
isoval = .5;
h = patch(isosurface(data,isoval),...
   'FaceColor','blue',...
   'EdgeColor','none',...
   'AmbientStrength',.2,...
   'SpecularStrength',.7,...
   'DiffuseStrength',.4);
isonormals(data,h)
3. 등가단면을 만들고 속성 설정하기
등가곡면과 동일한 데이터와 등가값을 사용하여 isocaps를 정의합니다. 보간 채색을 지정하고 디폴트 컬러맵(colormap)보다 파란색 등가곡면에 대해 더 나은 대비 색을 제공하는 컬러맵을 선택합니다.
patch(isocaps(data,isoval),...
   'FaceColor','interp',...
   'EdgeColor','none')
colormap hsv
4. 보기 정의하기
올바른 비율로 표시되도록 데이터 종횡비를 [1,1,1]로 설정합니다(daspect). 좌표축 내에서 흰색 공간을 제거하고 보기를 3차원으로 설정합니다(axis tight, view).
daspect([1,1,1])
axis tight
view(3)
5. 조명 추가하기
상당히 균일한 조명을 추가하되 도형의 미세한 변화를 볼 수 있게 해주는 광원의 장점은 그대로 활용하기 위해, 이 예제에서는 카메라의 좌우로 하나씩, 두 개의 조명을 사용합니다(camlight). 가장 부드러운 색 변화를 보여주기 위해 구로(Gouraud) 조명을 사용합니다(lighting).
camlight right
camlight left
