Main Content

isosurface

Extract isosurface data from volume data

Description

An isosurface is a 3-D surface representation of points with equal values in a 3-D data distribution. The isosurface function computes and draws a surface by connecting points of a constant value within a volume of space.

Plot Isosurface

isosurface(X,Y,Z,V,isovalue) determines where the volume data V is equal to the specified isovalue and plots the isosurface into the current axes.

example

Compute Isosurface Data as Structure

s = isosurface(X,Y,Z,V,isovalue) determines where the volume data V is equal to the specified isovalue and returns the faces and vertices data for the resulting surface in a structure.

example

s = isosurface(X,Y,Z,V) selects an isovalue by using a histogram of the data.

s = isosurface(V,isovalue) uses X, Y, and Z coordinates based on the size of V. The coordinates in each dimension start at 1 and form an m-by-n-by-p grid, where [m,n,p] = size(V).

s = isosurface(V) selects an isovalue by using a histogram of the data.

s = isosurface(___,colors) interpolates the array colors onto the scalar field and stores the data in the facevertexcdata field of the structure.

s = isosurface(___,'verbose') prints progress messages to the Command Window as the computation progresses.

s = isosurface(___,'noshare') does not create shared vertices. This syntax runs faster, but the list of resulting vertices can be substantially longer. Subsequent operations that process or plot the vertices might be slower.

Compute Isosurface Data as Arrays

[faces,verts] = isosurface(___) returns the faces and vertices in separate arrays.

[faces,verts,colors] = isosurface(___) returns the faces, vertices, and color data in separate arrays.

example

Examples

collapse all

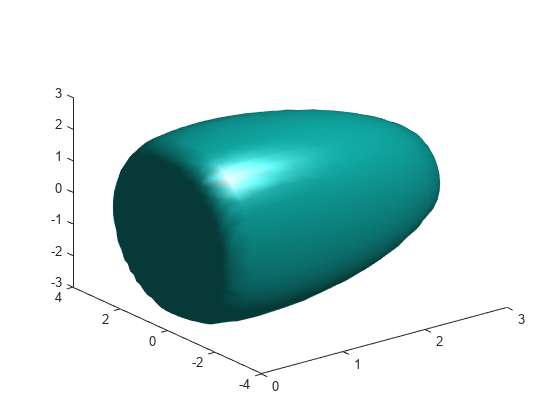
Create 3-D grid coordinates by using meshgrid and create volume data V. Then, create an isosurface within the volume by connecting points at the value .0001. Plot the isosurface.

[x,y,z] = meshgrid([-3:0.25:3]); 
V = x.*exp(-x.^2 -y.^2 -z.^2);
isosurface(x,y,z,V,1e-4);

Figure contains an axes object. The axes object contains an object of type patch.

Create an isosurface where the isovalue is 0.0001. Return the locations of the faces and vertices for the resulting surface in a structure.

[x,y,z] = meshgrid([-3:0.25:3]); 
V = x.*exp(-x.^2 -y.^2 -z.^2);
s = isosurface(x,y,z,V,1e-4)
s = struct with fields:
    vertices: [1693x3 double]
       faces: [3348x3 double]

Create an isosurface where the isovalue is .0001. Return the locations of the faces and vertices for the resulting surface as separate arrays.

[x,y,z] = meshgrid([-3:0.25:3]); 
V = x.*exp(-x.^2 -y.^2 -z.^2);
[faces,verts] = isosurface(x,y,z,V,1e-4)
faces = 3348×3

     1     2     3
     1     4     2
     2     4     5
     4     6     5
     5     6     7
     6     8     7
     9    10    11
     9    12    10
    10    12    13
    12    14    13
      ⋮

verts = 1693×3

    0.2500   -0.2500   -2.7918
    0.2181   -0.2500   -2.7500
    0.2500   -0.4366   -2.7500
    0.2500         0   -2.8092
    0.2049         0   -2.7500
    0.2500    0.2500   -2.7918
    0.2181    0.2500   -2.7500
    0.2500    0.4366   -2.7500
    0.5000   -0.7500   -2.7935
    0.4165   -0.7500   -2.7500
      ⋮

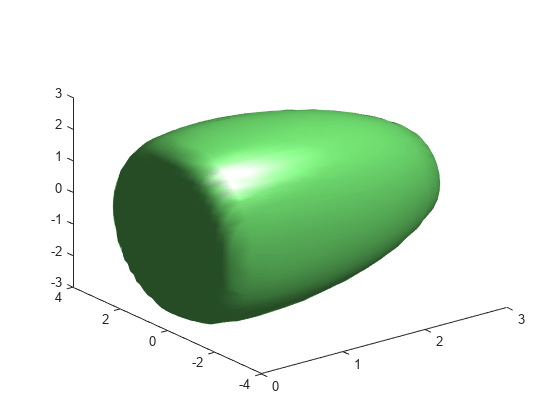
Create an isosurface where the isovalue is 0.0001. Compute the locations of the faces and vertices as a structure. Then, plot the face and vertex data by passing the structure data to the patch function. Adjust the view of the plot, change the surface colors, and specify custom lighting.

[x,y,z] = meshgrid([-3:0.25:3]); 
V = x.*exp(-x.^2 -y.^2 -z.^2);
s = isosurface(x,y,z,V,1e-4);
p = patch(s);
isonormals(x,y,z,V,p)
view(3);
set(p,'FaceColor',[0.5 1 0.5]);  
set(p,'EdgeColor','none');
camlight;
lighting gouraud;

Figure contains an axes object. The axes object contains an object of type patch.

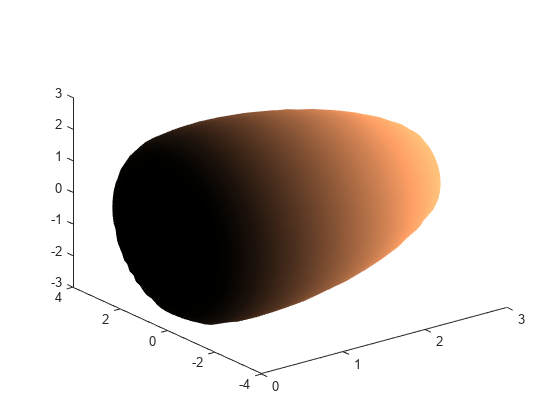
Visualize the flow data but color code the surface to indicate magnitude along the x-axis. First, compute the color data by specifying a vector containing a scalar value for each vertex in the isosurface. The colors are mapped to the current colormap.

[x,y,z] = meshgrid([-3:0.25:3]); 
V = x.*exp(-x.^2 -y.^2 -z.^2);
[faces,verts,colors] = isosurface(x,y,z,V,1e-4,x);

Then, plot the isosurface with the computed color data by passing the data to the patch function. Set the camera angle and aspect ratio and change the colormap.

patch('Vertices',verts,'Faces',faces,'FaceVertexCData',colors,...
    'FaceColor','interp','EdgeColor','interp')
view(3) 
colormap copper

Figure contains an axes object. The axes object contains an object of type patch.

Input Arguments

collapse all

x axis coordinate data, specified as a vector or a 3-D array the same size as V. If you specify a 3-D array, it must be monotonic and orthogonally spaced, as if produced by the meshgrid function.

Data Types: single | double

y-axis coordinate data, specified as a vector or a 3-D array the same size as V. If you specify a 3-D array, it must be monotonic and orthogonally spaced, as if produced by the meshgrid function.

Data Types: single | double

z-axis coordinate data, specified as a vector or a 3-D array the same size as V. If you specify a 3-D array, it must be monotonic and orthogonally spaced, as if produced by the meshgrid function.

Data Types: single | double

Volume data, specified as a 3-D array of the same size as X, Y, and Z.

Data Types: single | double

Isovalue at which to compute the surface, specified as a scalar.

Data Types: single | double

Color data, specified as a vector or 3-D array the same size as V. Use this argument to control the color mapping of the isosurface with data different from that used to calculate the isosurface. This argument overlays another data set by coloring the resulting isosurface. The vector or array contains a scalar value for each vertex in the isosurface and is mapped using the current color map.

You can use the colormap function to customize the color scheme. This customization requires changing values in an array that controls the relationship between the surface and the colormap. The index array associates specific locations of the plot with colors in the colormap. By default, the intermediate values in C map linearly to the intermediate rows in the colormap.

Data Types: single | double

Output Arguments

collapse all

Isosurface data, returned as a structure with the fields faces and vertices containing the corresponding faces and vertices data.

Data Types: single | double

Face data of the computed isosurface, returned as an array.

Data Types: single | double

Vertex data of the computed isosurface, returned as an array.

Data Types: single | double

Color data of the computed isosurface, returned as an array containing the scalar value for interpolated color data of each vertex, to be portrayed with the current color map. The size of the colors array must be the same as V.

Data Types: single | double

Tips

  • If you want to specify a custom camera view, lighting, or a different color map of the surface, use the patch function to plot the data returned from isosurface. You can pass the structure created by isosurface directly to the patch command. For example:

    s = isosurface(X,Y,Z,V,isovalue);
    patch(s)
  • Alternatively, you can pass the individual faces and vertices arrays to patch by specifying property names. For example:

    [faces,verts] = isosurface(X,Y,Z,V,isovalue) ;
    patch('Faces',faces,'Vertices',verts);

Extended Capabilities

Version History

Introduced before R2006a