cuboidModel
Object for storing parametric cuboid model
Description
The cuboidModel object stores the parameters of a parametric
cuboid model. After you create a cuboidModel object, you can extract cuboid
corner points, and points within the cuboid using the object functions. Cuboid models are used
to store the output of pcfitcuboid
function. It is a shape fitting function which fits a cuboid over a point
cloud.
Creation
There are two ways to create a cuboidModel object.
Create a cuboid model by specifying the cuboid parameters in the
cuboidModelfunction.Fit a cuboid model over a point cloud using the
pcfitcuboidfunction.
Description
model = cuboidModel(params)params.
model = pcfitcuboid(ptCloudIn)pcfitcuboid
function stores the properties of the cuboid in a parametric cuboid model object,
model.
model = pcfitcuboid(ptCloudIn,indices)indices, in the input
point cloud.
Properties
This property is read-only.
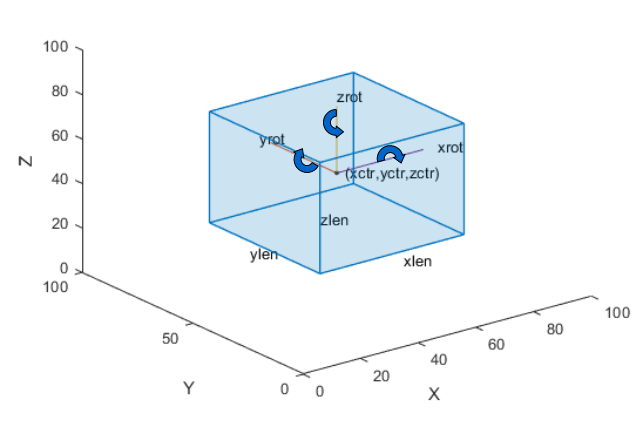
Cuboid model parameters, stored as a nine-element row vector of the form [xctr yctr zctr xlen ylen zlen xrot yrot zrot].
xctr, yctr, and zctr specify the center of the cuboid.
xlen, ylen, and zlen specify the length of the cuboid along the x-, y-, and z-axis, respectively, before rotation has been applied.
xrot, yrot, and zrot specify the rotation angles in degrees for the cuboid along the x-, y-, and z-axis, respectively. These angles are clockwise-positive when looking in the forward direction of their corresponding axes.
The figure shows how these values determine the position of a cuboid.
These parameters are specified by the params
input argument.
Data Types: single | double
This property is read-only.
Center of the cuboid, stored as a three-element row vector of the form [xctr yctr zctr]. The vector contains the 3-D coordinates of the cuboid center in the x-, y-, and z-axis, respectively.
This property is derived from the Parameters property.
Data Types: single | double
This property is read-only.
Dimensions of the cuboid, stored as a three-element row vector of the form [xlen ylen zlen]. The vector contains the length of the cuboid along the x-, y-, and z-axis, respectively.
This property is derived from the Parameters property.
Data Types: single | double
This property is read-only.
Orientation of the cuboid, stored as a three-element row vector of the form, [xrot yrot zrot], in degrees. The vector contains the rotation of the cuboid along the x-, y-, and z-axis, respectively.
This property is derived from the Parameters property.
If the orientation is in quaternion, convert the quaternion to Euler angles in degrees to create a cuboid model.
Data Types: single | double
Object Functions
getCornerPoints | Get corner points of cuboid model |
findPointsInModel | Find points enclosed by cuboid model |
plot | Plot cuboid model |
Examples
Detect a cuboid in a point cloud using pcfitcuboid function. The function stores the cuboid parameters as a cuboidModel object.
Read point cloud data into the workspace.
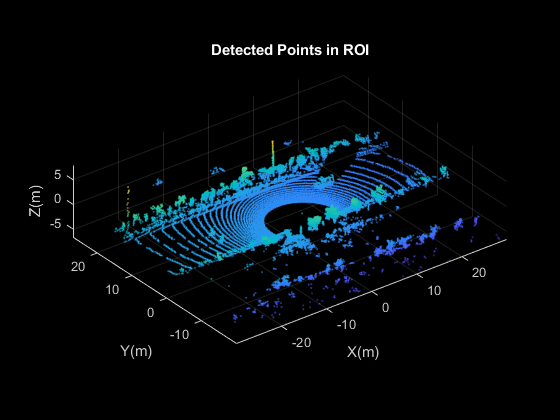
ptCloud = pcread('highwayScene.pcd');Search the point cloud within a specified region of interest (ROI). Create a point cloud of only the detected points.
roi = [-30 30 -20 30 -8 13];
in = findPointsInROI(ptCloud,roi);
ptCloudIn = select(ptCloud,in);
Plot the point cloud of detected points.
   figure
   pcshow(ptCloudIn.Location)
   xlabel('X(m)')
   ylabel('Y(m)')
   zlabel('Z(m)')
   title('Detected Points in ROI')
Find the indices of the points in a specified ROI within the point cloud.
roi = [9.6 13.8 7.9 9.3 -2.5 3];
sampleIndices = findPointsInROI(ptCloudIn,roi);
Fit a cuboid to the selected set of points in the point cloud.
 model = pcfitcuboid(ptCloudIn,sampleIndices);
  figure
  pcshow(ptCloudIn.Location)
  xlabel('X(m)')
  ylabel('Y(m)')
  zlabel('Z(m)')
  title('Detect a Cuboid in a Point Cloud')
Plot the cuboid box in the point cloud.
hold on
plot(model)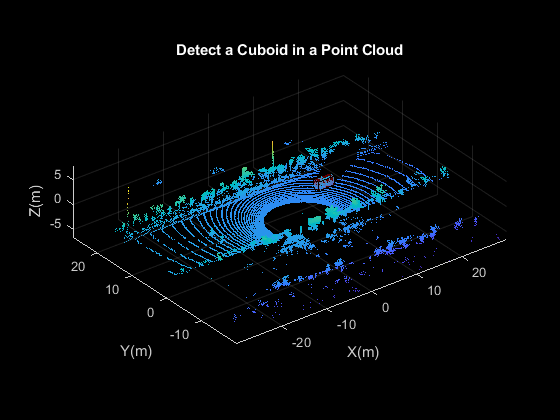
Display the internal properties of the cuboidModel object.
model
model =
  cuboidModel with properties:

     Parameters: [11.4873 8.5997 -1.6138 3.6713 1.3220 1.7576 0 0 0.9999]
         Center: [11.4873 8.5997 -1.6138]
     Dimensions: [3.6713 1.3220 1.7576]
    Orientation: [0 0 0.9999]
Fit cuboid bounding boxes around clusters in a point cloud.
Load the point cloud data into the workspace.
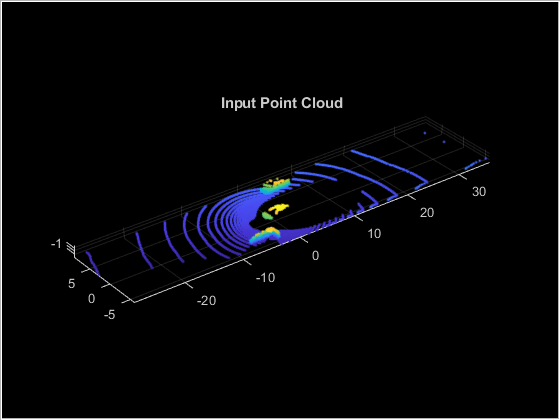
data = load('drivingLidarPoints.mat');Define and crop a region of interest (ROI) from the point cloud. Visualize the selected ROI of the point cloud.
roi = [-40 40 -6 9 -2 1];
in = findPointsInROI(data.ptCloud,roi);
ptCloudIn = select(data.ptCloud,in);
hcluster = figure;
panel = uipanel('Parent',hcluster,'BackgroundColor',[0 0 0]);
ax = axes('Parent',panel,'Color',[0 0 0]);
pcshow(ptCloudIn,'MarkerSize',30,'Parent',ax)
title('Input Point Cloud')
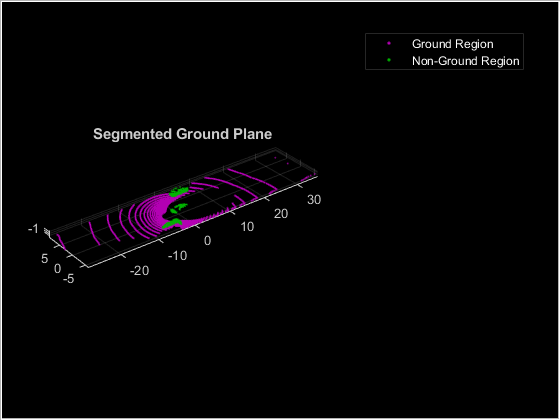
Segment the ground plane. Visualize the segmented ground plane.
maxDistance = 0.3;
referenceVector = [0 0 1];
[~,inliers,outliers] = pcfitplane(ptCloudIn,maxDistance,referenceVector);
ptCloudWithoutGround = select(ptCloudIn,outliers,'OutputSize','full');
hSegment = figure;
panel = uipanel('Parent',hSegment,'BackgroundColor',[0 0 0]);
ax = axes('Parent',panel,'Color',[0 0 0]);
pcshowpair(ptCloudIn,ptCloudWithoutGround,'Parent',ax)
legend('Ground Region','Non-Ground Region','TextColor', [1 1 1])
title('Segmented Ground Plane')
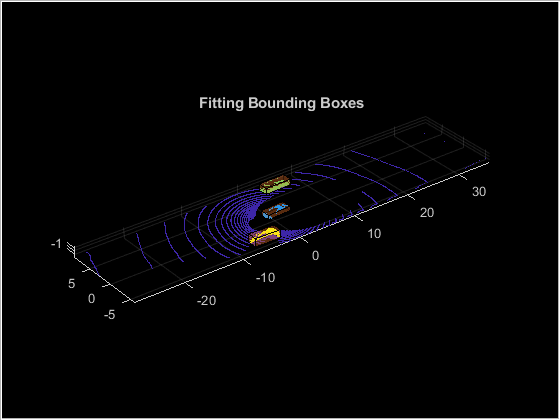
Segment the non-ground region of the point cloud into clusters. Visualize the segmented point cloud.
distThreshold = 1;
[labels,numClusters] = pcsegdist(ptCloudWithoutGround,distThreshold);
labelColorIndex = labels;
hCuboid = figure;
panel = uipanel('Parent',hCuboid,'BackgroundColor',[0 0 0]);
ax = axes('Parent',panel,'Color',[0 0 0]);
pcshow(ptCloudIn.Location,labelColorIndex,'Parent',ax)
title('Fitting Bounding Boxes')
hold on
Fit bounding box on each cluster, visualized as orange highlights.
for i = 1:numClusters
    idx = find(labels == i);
    model = pcfitcuboid(ptCloudWithoutGround,idx);
    plot(model)
end
Extended Capabilities
Version History
Introduced in R2020b