다음에 대한 결과:

The example code below shows how to write version 7.3 MAT files directly from C++ using the HDF5 library (libhdf5) and HighFive, a header-only C++ wrapper for libhdf5. Version 7.3 MAT files are HDF5-based, but contain a proprietary header in the first 512 bytes of the file.
The implementation performs three primary tasks:
First, it creates an HDF5 file with a 512-byte userblock. After data has been added into the file, the file is closed. Then a 128-byte header is written into the userblock so that the file is recognized by MATLAB as a valid version-7.3 MAT file. This is done in function “makeMatHeader”.
Second, MATLAB-specific metadata attributes are added to each dataset. Attributes such as “MATLAB_class” and “MATLAB_int_decode” inform MATLAB how each dataset should be interpreted.
Third, MATLAB-compatible complex datasets are created by overriding HighFive's default complex-number layout. HighFive uses the field names `r` and `i` by default, while MATLAB expects `real` and `imag`. A Highfive custom compound type is therefore registered for `std::complex<double>` using the MATLAB field names.
With these changes in place, C++ code can write scalar values, vectors, structs, complex arrays, and character arrays to a file that MATLAB can read as a version 7.3 MAT file.
#include <iostream>
#include <vector>
#include <complex>
#include <cstddef>
#include <fstream>
#include <string>
#include <cstdint>
#include <utility>
#include <bitset>
#include <highfive/highfive.hpp>
#include "hdf5.h"
// Modify the 512-byte userblock at the front of the HDF5 file to make it compatible with MATLAB's v7.3 MAT file format.
void makeMatHeader(std::string filename)
{
char header[512]; // MATLAB-style header for HDF5 file
memset(header, 0, sizeof(header)); // Initialize header to all zeros
// Example header content
snprintf(header, sizeof(header), "MATLAB 7.3 MAT-file, Platform: HDF5");
header[124] = 0;
header[125] = 2;
// I/M indicate little-endian format (Intel Mac/Windows)
header[126] = 'I';
header[127] = 'M';
// Write the header to the beginning of the file
std::ofstream outFile(filename, std::ios::binary | std::ios::in | std::ios::out);
outFile.seekp(0);
outFile.write(header, sizeof(header));
outFile.close();
}
// https://www.geeksforgeeks.org/dsa/inplace-m-x-n-size-matrix-transpose/
void MatrixInplaceTranspose(int *A, int rows, int cols)
{
// Moves elements in-place to achieve the transpose.
// A is a pointer to a 2D array, rows is the number of rows, and cols is the number of columns.
int size = rows*cols - 1;
int t; // holds element to be replaced, eventually becomes next element to move
int next; // location of 't' to be moved
int cycleBegin; // holds start of cycle
int i; // iterator
const int HASH_SIZE = 8192; // define a suitable hash size for the bitset. Must be at least as large as the number of elements in the matrix.
std::bitset<HASH_SIZE> b; // hash to mark moved elements. Must be large enough to cover all indices.
if (rows <= 0 || cols <= 0) {
throw std::invalid_argument("Matrix dimensions must be positive");
}
else if ((rows * cols) > HASH_SIZE)
{
throw std::invalid_argument("Matrix size exceeds hash size for in-place transpose. Increase the HASH_SIZE constant.");
}
b.reset();
b[0] = b[size] = 1;
i = 1; // Note that A[0] and A[size-1] won't move
while (i < size)
{
cycleBegin = i;
t = A[i];
do
{
// Input matrix [rows x cols]
// Output matrix [cols x rows]
// i_new = (i*rows)%(N-1)
next = (i*rows)%size;
std::swap(A[next], t);
b[i] = 1;
i = next;
}
while (i != cycleBegin);
// Get Next Move (what about querying random location?)
for (i = 1; (i < size) && b[i]; i++)
;
}
}
template <typename T>
std::vector<std::vector<T>> transpose(const std::vector<std::vector<T>>& matrix)
{
// Performs a nonconjugate transpose on a vector of vectors
// The input matrix is a vector of vectors, where each inner vector represents a row of the matrix.
// Handle empty matrix edge case
if (matrix.empty() || matrix[0].empty()) {
return {};
}
size_t rows = matrix.size();
size_t cols = matrix[0].size();
// Initialize the transposed matrix with flipped dimensions: cols x rows
std::vector<std::vector<T>> transposed(cols, std::vector<T>(rows));
for (size_t i = 0; i < rows; ++i) {
for (size_t j = 0; j < cols; ++j) {
transposed[j][i] = matrix[i][j];
}
}
return transposed;
}
// Creates a HighFive compound type for representing MATLAB-style complex numbers
// HighFive by default uses r/i but that is not compatible with MATLAB's complex number representation, which uses real/imag.
HighFive::CompoundType matlabComplexDouble () {
return {
{"real", HighFive::AtomicType<double>{}},
{"imag", HighFive::AtomicType<double>{}}
};
}
// Register the CompoundType to represent std::complex<double>
HIGHFIVE_REGISTER_TYPE(std::complex<double>, matlabComplexDouble);
int main()
{
const std::string filename = "test.mat";
// Needed for the complex number literal suffix 'i'
using namespace std::literals;
/*
* MATLAB vs C++ array layout
*
* MATLAB stores arrays in column-major order, meaning values in the same column are
* laid out next to each other in memory. Typical C++ containers such as nested std::vector and arrays
* are written in row-major order, where values in the same row are adjacent in memory.
*
* That difference matters when something such as a 2D dataset is exchanged from C++ to MATLAB. A 2x3
* matrix written from C++ in row-major order will be interpreted by MATLAB as a 3x2 matrix, transposed relative
* to the original C++ layout. The user will have to transpose the array to view the original C++ layout
* correctly.
*
* C++ developers need to be aware of the memory layout when
* exchanging multidimensional arrays with MATLAB. To maintain the structure,
* one will need to transpose the array before writing it to the mat file.
*/
// Test data
// 2x3 Array of complex double
std::vector<std::vector<std::complex<double>>> dataComplex = {{10.0 + 1.0i, 20.0 + 2.0i, 30.0 + 3.0i},
{40.0 + 4.0i, 50.0 + 5.0i, 60.0 + 6.0i}};
// 1x3 Vector of double
std::vector<double> dataDoubleVec = {1.1, 2.2, 3.3};
// 1x5 Array of integers
int dataIntArray[5] = {1, 2, 3, 4, 5};
// 2x4 Array of integers
int dataIntArray2x4[2][4] = {{1, 2, 3, 4},
{5, 6, 7, 8}};
int dataInt = 79;
double dataDouble = 3.14;
std::string dataString = "Hello, MATLAB!!!!!";
{
// Put the highfive related code into its own block so that the file gets closed when the file object is no longer in scope.
// Create a highfive file create property, get the underlying HDF5 property ID, and set a userblock size
HighFive::FileCreateProps fcp = HighFive::FileCreateProps::Empty();
hid_t fcpl_id = fcp.getId();
H5Pset_userblock(fcpl_id, 512);
HighFive::File file(filename, HighFive::File::Truncate, fcp);
// Storing a double to the file
// For something that is only a single value, must create a 1x1 dataspace
HighFive::DataSpace scalarDoubleSpace({1, 1});
// This creates a variable in the MATLAB workspace with the name "double_value"
HighFive::DataSet doubleField = file.createDataSet<double>("double_value", scalarDoubleSpace);
doubleField.write(dataDouble);
// Metadata for MATLAB compatibility
doubleField.createAttribute("MATLAB_class", std::string("double"));
// Storing an integer to the file
// For something that is only a single value, must create a 1x1 dataspace
HighFive::DataSpace scalarIntSpace({1, 1});
// This creates a variable in the MATLAB workspace with the name "int_value"
HighFive::DataSet intField = file.createDataSet<int>("int_value", scalarIntSpace);
intField.write(dataInt);
// Metadata for MATLAB compatibility
intField.createAttribute("MATLAB_class", std::string("int32"));
// Storing a C-style 1x5 array of integers to the file
// Since it is a single dimension, there is no need to move the data, just reinterpret it as a 5x1 row-major array.
// When Matlab imports it, it will perceive it as a 1x5 column-major array.
// This line casts the 1x5 array to a 5x1 array to match MATLAB's column-major order
int (*numArrayTrans5x1)[1] = reinterpret_cast<int (*)[1]>(dataIntArray);
HighFive::DataSpace intArray5x1Space({5, 1});
// This creates a variable in the MATLAB workspace with the name "int_array"
HighFive::DataSet intArrayField = file.createDataSet<int>("int_array", intArray5x1Space);
intArrayField.write(numArrayTrans5x1);
intArrayField.createAttribute("MATLAB_class", std::string("int32"));
// Storing a C-style 2x4 array of integers to the file
// For something that is a multi-dimensional array, we need to transpose the array and create a dataspace with the dimensions swapped
// so that the data is stored in column-major order.
MatrixInplaceTranspose((int*)dataIntArray2x4, 2, 4);
// After moving the values around, we need to cast the array with the new dimensions to match the new layout
// Cast the transposed 2x4 array to a 4x2 array to match MATLAB's column-major order
int (*numArrayTrans)[2] = reinterpret_cast<int (*)[2]>(dataIntArray2x4);
HighFive::DataSpace intArray2x4Space({4, 2});
// This creates a variable in the MATLAB workspace with the name "int_array_2x4"
HighFive::DataSet intArray2x4Field = file.createDataSet<int>("int_array_2x4", intArray2x4Space);
intArray2x4Field.write(numArrayTrans);
intArray2x4Field.createAttribute("MATLAB_class", std::string("int32"));
// Creating a Matlab struct (HDF5 group)
HighFive::Group my_struct = file.createGroup("my_struct");
my_struct.createAttribute("MATLAB_class", std::string("struct"));
// The only difference between storing data into a struct or as a normal variable in the MAT file is the
// the parent object you use when you do "createDataSet".
// file.createDataSet would create a normal variable, my_struct.createDataSet creates it within the "my_struct" struct.
// Storing a string to the struct so that it will be accessible as a character array in MATLAB
// For something that is a string, we create a dataspace with dimensions [string_length, 1] and save the character data accordingly
// We create a vector that has dataString.size() elements, each of which is a char vector of size 1 to store individual characters.
std::vector<std::vector<char>> text_bytes(dataString.size(), std::vector<char>(1));
// MATLAB expects character arrays to be a row vector so we reshape it accordingly since dimensions are swapped between C++ and MATLAB
for (int i = 0; i < dataString.size(); ++i) {
text_bytes[i][0] = dataString[i];
}
HighFive::DataSpace charSpace({dataString.size(), 1});
// uint16_t is required for MATLAB character arrays
HighFive::DataSet textField = my_struct.createDataSet<uint16_t>("text_value", charSpace);
textField.write(text_bytes);
// Metadata for MATLAB compatibility
textField.createAttribute("MATLAB_class", std::string("char"));
// Tell MATLAB to interpret the data as characters rather than integers
textField.createAttribute("MATLAB_int_decode", 2);
// Storing a vector to the struct
// In order to transpose the vector correctly, we first wrap it in another vector to make it a 2D array.
std::vector<std::vector<double>> transposableDoubleVec = { dataDoubleVec };
// For vectors, we let HighFive infer the dataspace from the data itself
// Transpose the vector to match MATLAB's column-major order
HighFive::DataSet doubleVectorField = my_struct.createDataSet("double_vector", transpose(transposableDoubleVec));
// Metadata for MATLAB compatibility
doubleVectorField.createAttribute("MATLAB_class", std::string("double"));
// Storing a complex (and multi-dimensional) vector to the struct
// For multi-dimensional vectors, we need to perform a noncojugate transpose on the array to match
// MATLAB's column-major order so the data layout is consistent between C++ and MATLAB.
// For vectors, we let HighFive infer the dataspace from the data itself
HighFive::DataSet complexField = my_struct.createDataSet("complex_vector", transpose(dataComplex));
// Metadata for MATLAB compatibility
complexField.createAttribute("MATLAB_class", std::string("complex"));
}
// Finalize the MATLAB-compatible HDF5 file by writing the MATLAB header into the userblock
makeMatHeader(filename);
return 0;
}

For those using Matlab and ecountering difficulty with mex and Xcode v27
Fix for Xcode 27 breaking MATLAB MEX C++ compilation:
matlab
edit(fullfile(prefdir,'mex_C++_maca64.xml'))
% Set LINKEXPORTCPP=""
% Then rebuild normally

If you're a student looking for tips, resources, or guidance for learning MATLAB, check out my new blog: Learn MATLAB – A Student’s Guide
The blog highlights a variety of student resources, including getting started guides, cheat sheets, learning materials, and other helpful tools to make learning MATLAB easier. I hope you find it useful!

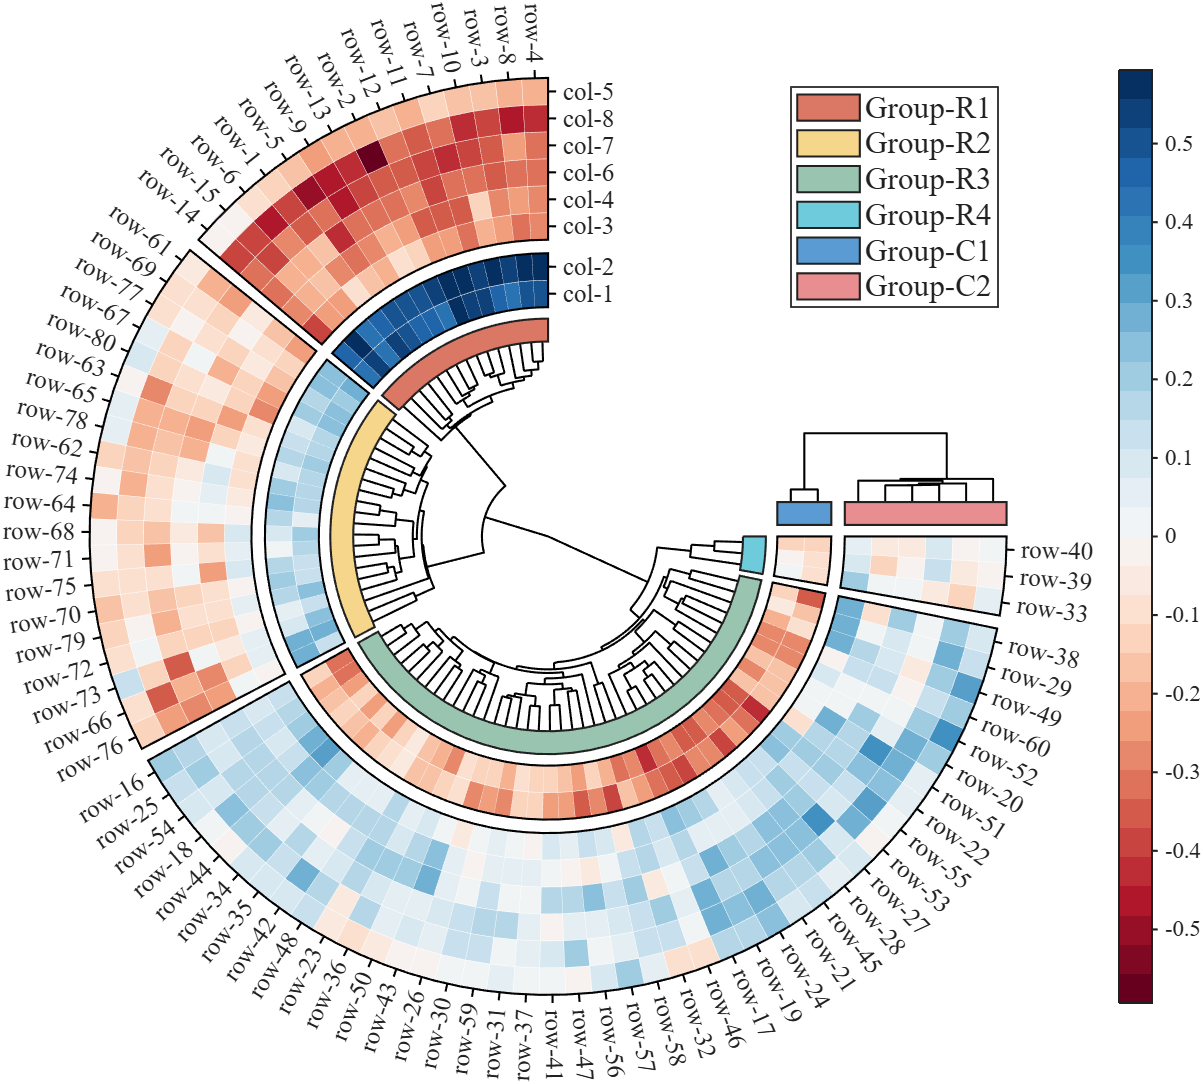
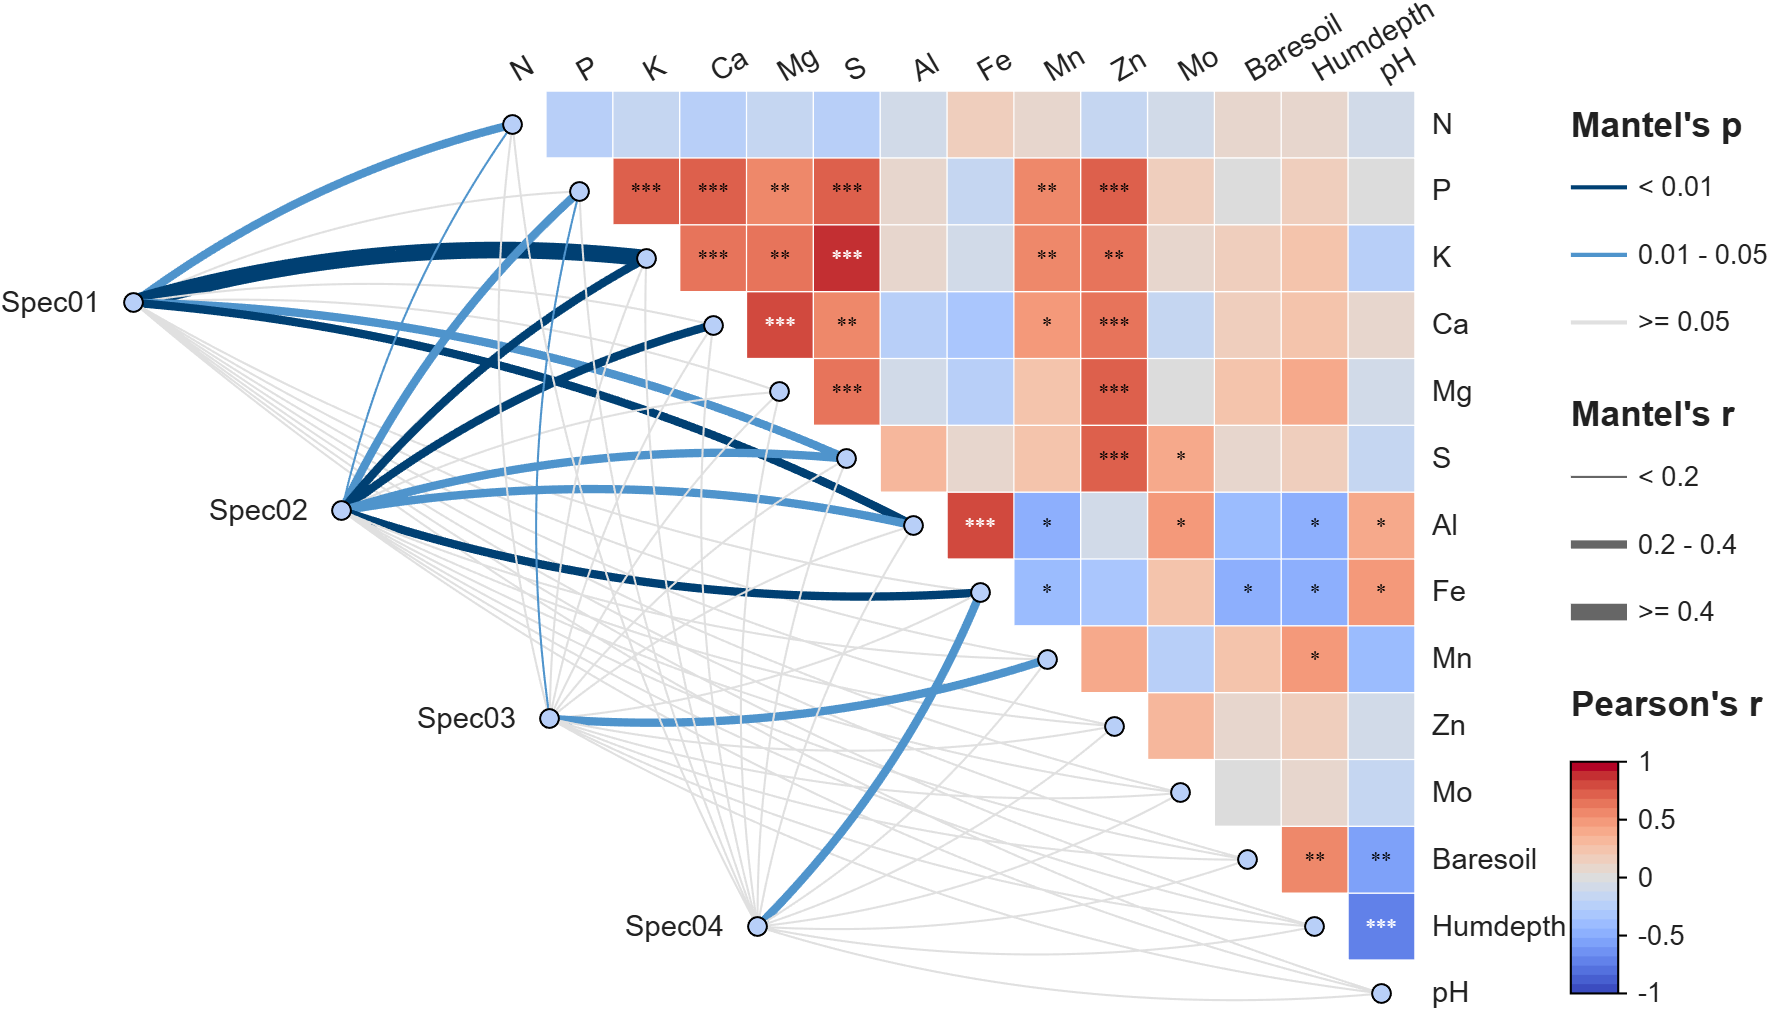
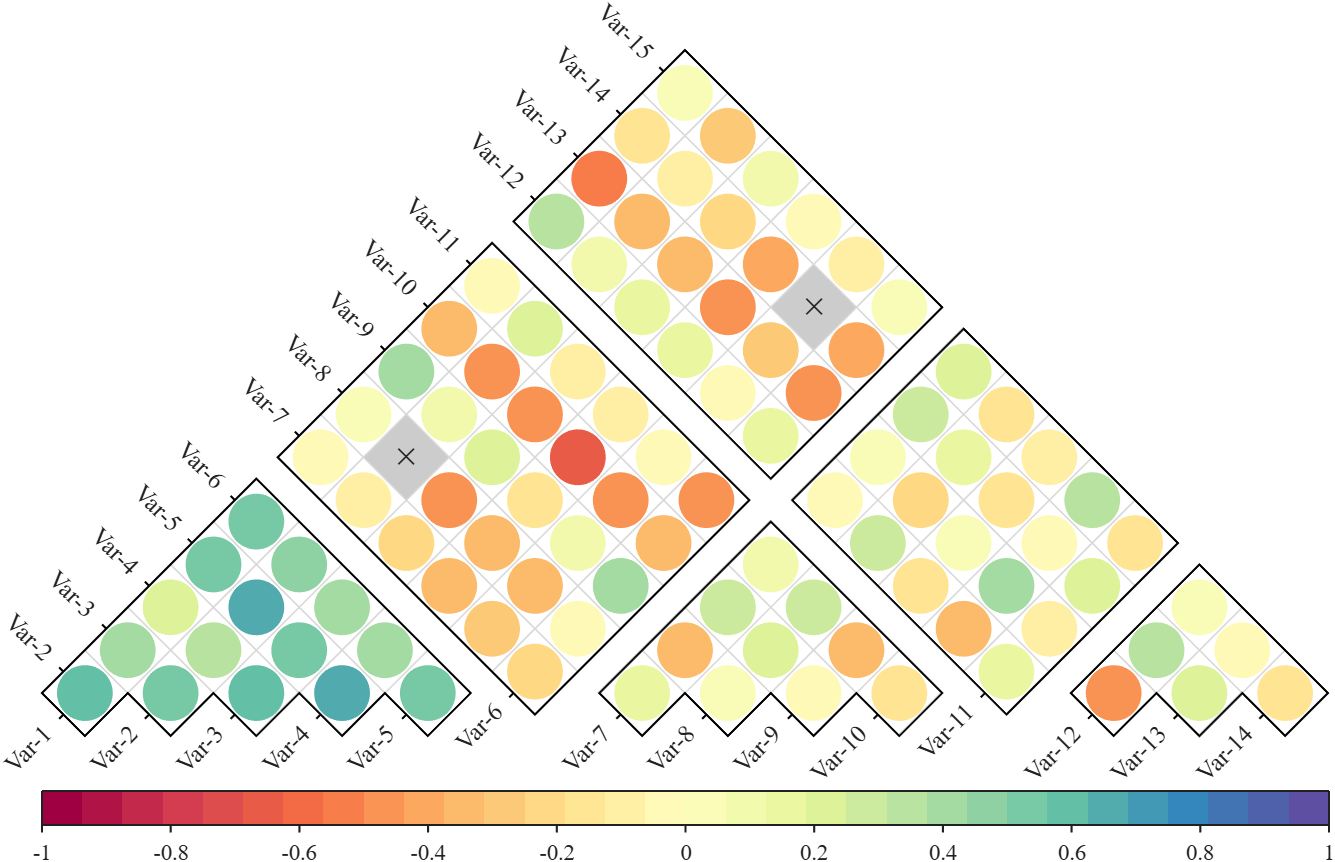
Annular, sector, triangular, and cluster heatmaps can all be produced by this tool:https://www.mathworks.com/matlabcentral/fileexchange/125520-special-heatmap
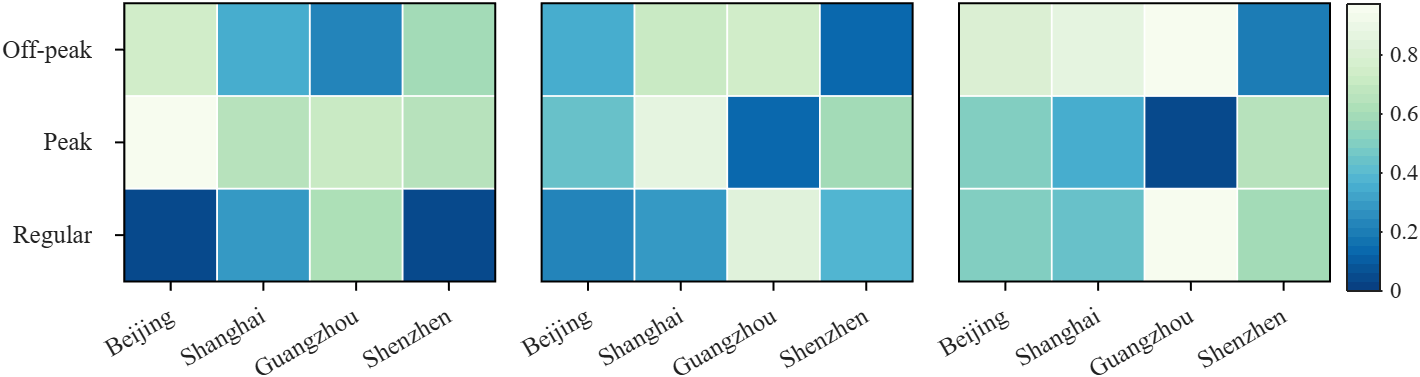
Demo: Group Sep with non-square matrix
Data = rand(3, 12);
SHM = SHeatmap(Data, 'Format','sq');
SHM.RowName = {'Off-peak', 'Peak', 'Regular'};
SHM.ColName = {'Beijing', 'Shanghai', 'Guangzhou', 'Shenzhen'};
SHM.ColGroup = [1,1,1,1, 2,2,2,2, 3,3,3,3];
SHM.draw().setFrame()
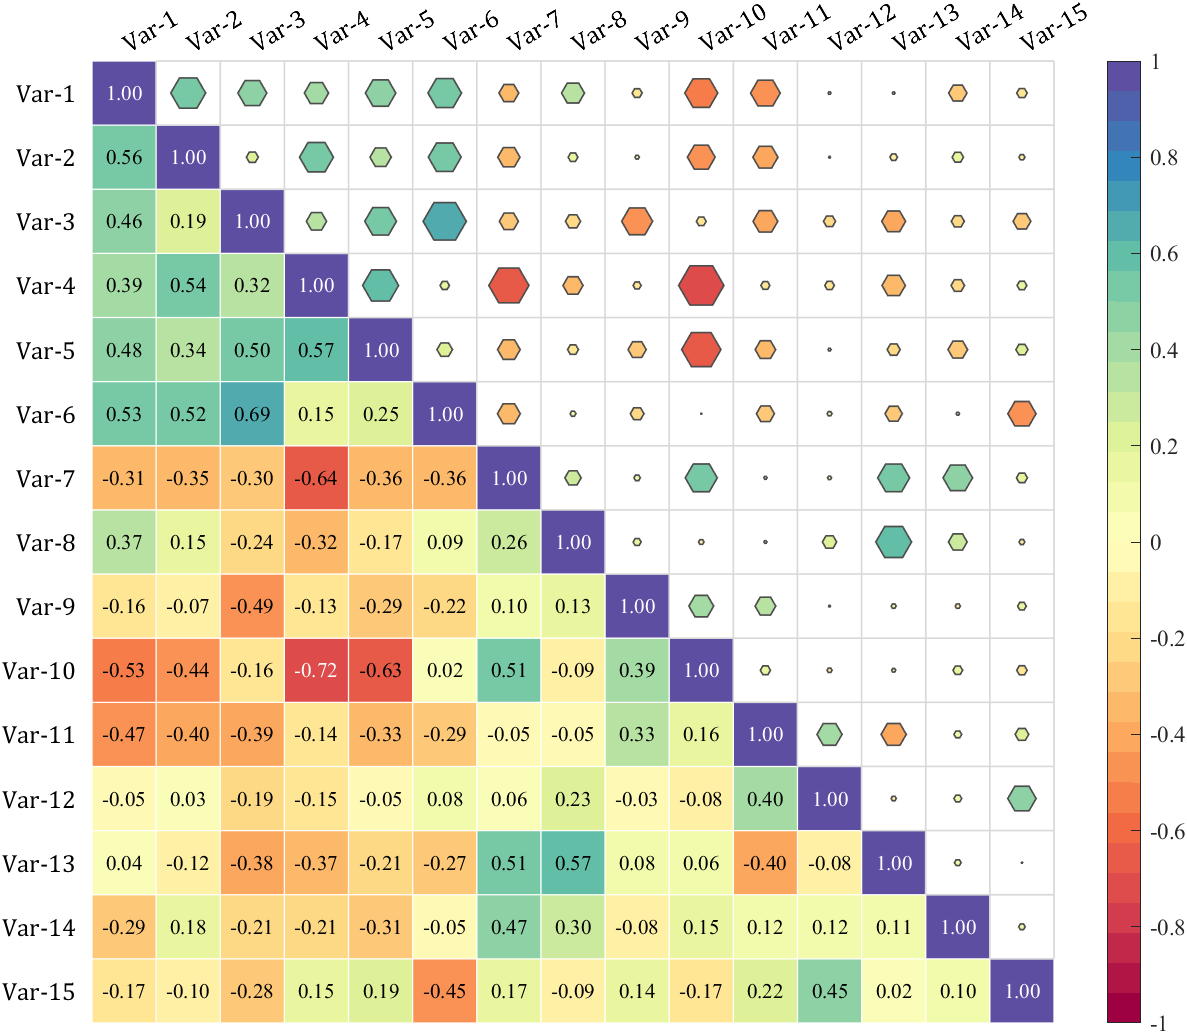
Demo: Merge two triangle heatmaps
% Made up some data casually (随便捏造了点数据)
X = randn(20,15) + [(linspace(-1,2.5,20)').*ones(1, 6), (linspace(.5,-.7,20)').*ones(1, 5), (linspace(.9,-.2,20)').*ones(1, 4)];
% Get the correlation matrix (求相关系数矩阵)
Data = corr(X);
figure()
SHM_m1 = SHeatmap(Data, 'Format','sq').draw().setType('tril');
SHM_m1.setColLabel('Visible','off').setText()
SHM_m2 = SHeatmap(Data, 'Format','hex').draw().setType('triu0');
SHM_m2.setRowLabel('Visible','off').setColLabel('Visible','on') % Show the hidden Var-1 label (显示隐藏的 Var-1 标签)
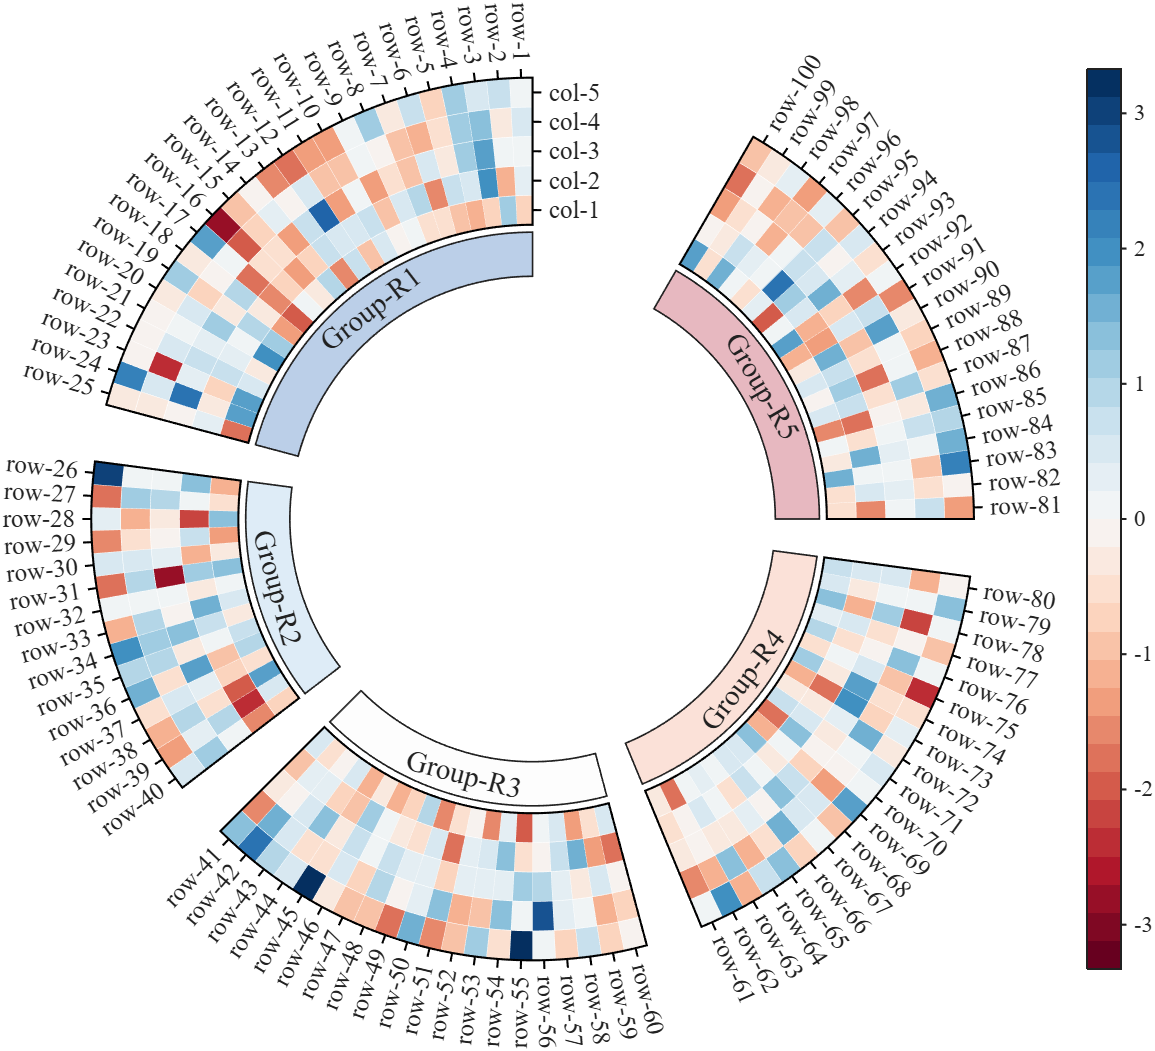
Demo: Circular heatmap with Group Block and GroupSep
% Circular heatmap is currently supported only for
% SHeatmap with 'sq' Format and 'full' Type.
rng(1)
Data = randn(100, 5);
rowName = compose('row-%d', 1:100);
colName = compose('col-%d', 1:5);
rowGroup = [ones(1, 25), 2.*ones(1, 15), 3.*ones(1, 20), 4.*ones(1, 20), 5.*ones(1, 20)];
rowColor = [187,207,232; 222,236,247; 253,253,253; 251,225,216; 231,184,192]./255;
rgnames = {'Group-R1','Group-R2','Group-R3','Group-R4','Group-R5'};
% create figure (图窗创建)
fig = figure('Units','normalized', 'Position',[.1,.05,.5,.72]);
ax = axes('Parent',fig, 'Position',[.1,.1,.75,.75]);
% Draw group block (绘制分组方块)
SCB_L = SClusterBlock(ax, rowGroup, 'Orientation','left', 'ColorList',rowColor, 'Group',rowGroup, 'GroupSep',2.5);
SCB_L.draw(); SCB_L.setXYTLim('XLim',[1.65,1.95], 'YLim',[0, 1], 'TLim',[-3*pi/2, pi/3]);
% Draw circular heatmap (绘制环形热图)
SHM = SHeatmap(ax, Data, 'Format','sq', 'RowGroup',rowGroup, 'GroupSep',2.5);
SHM.TickLength = .3;
SHM.draw();
SHM.setRowName(rowName)
SHM.setColName(colName)
SHM.setRowLabelLocation('right')
SHM.setColLabelLocation('top')
% YLim(1) -> TLim(1), YLim(2) -> TLim(2)
SHM.setXYTLim('XLim',[2, 3], 'YLim',[0, 1], 'TLim',[-3*pi/2, pi/3]);
SHM.Colorbar.Position(1) = SHM.Colorbar.Position(1) + .1;
gHdl = text(ax, SCB_L.X, SCB_L.Y, rgnames, 'FontSize',14, 'FontName','Times New Roman');
setTextPerpRadial(gHdl)
colormap(slanCM(97, 32))
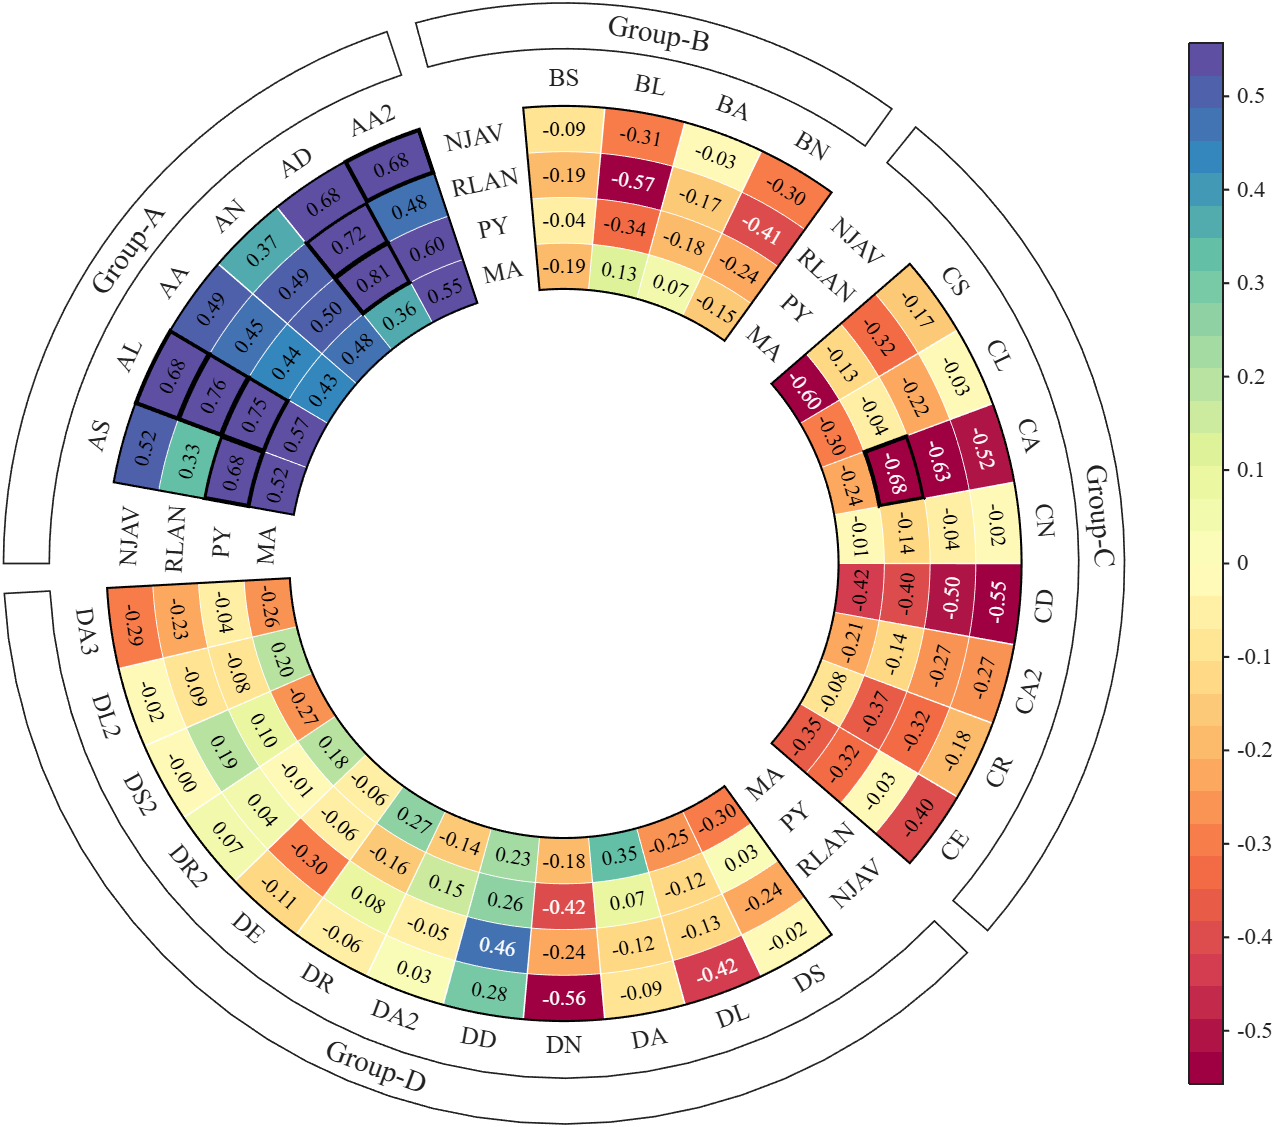
More than 50 examples are incorporated into this tool:
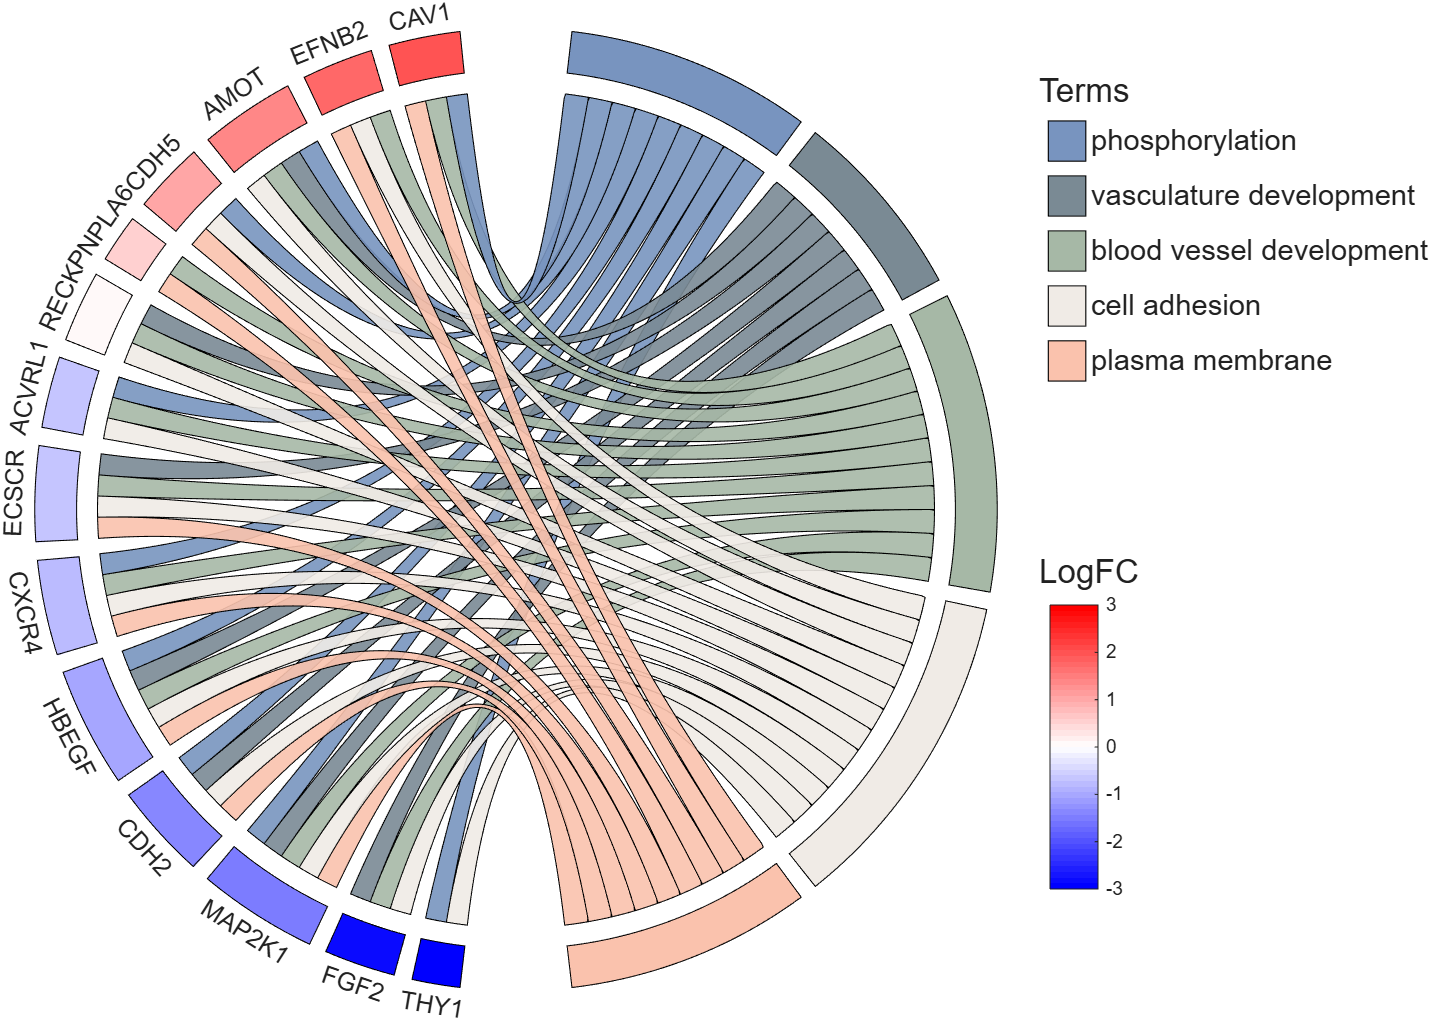
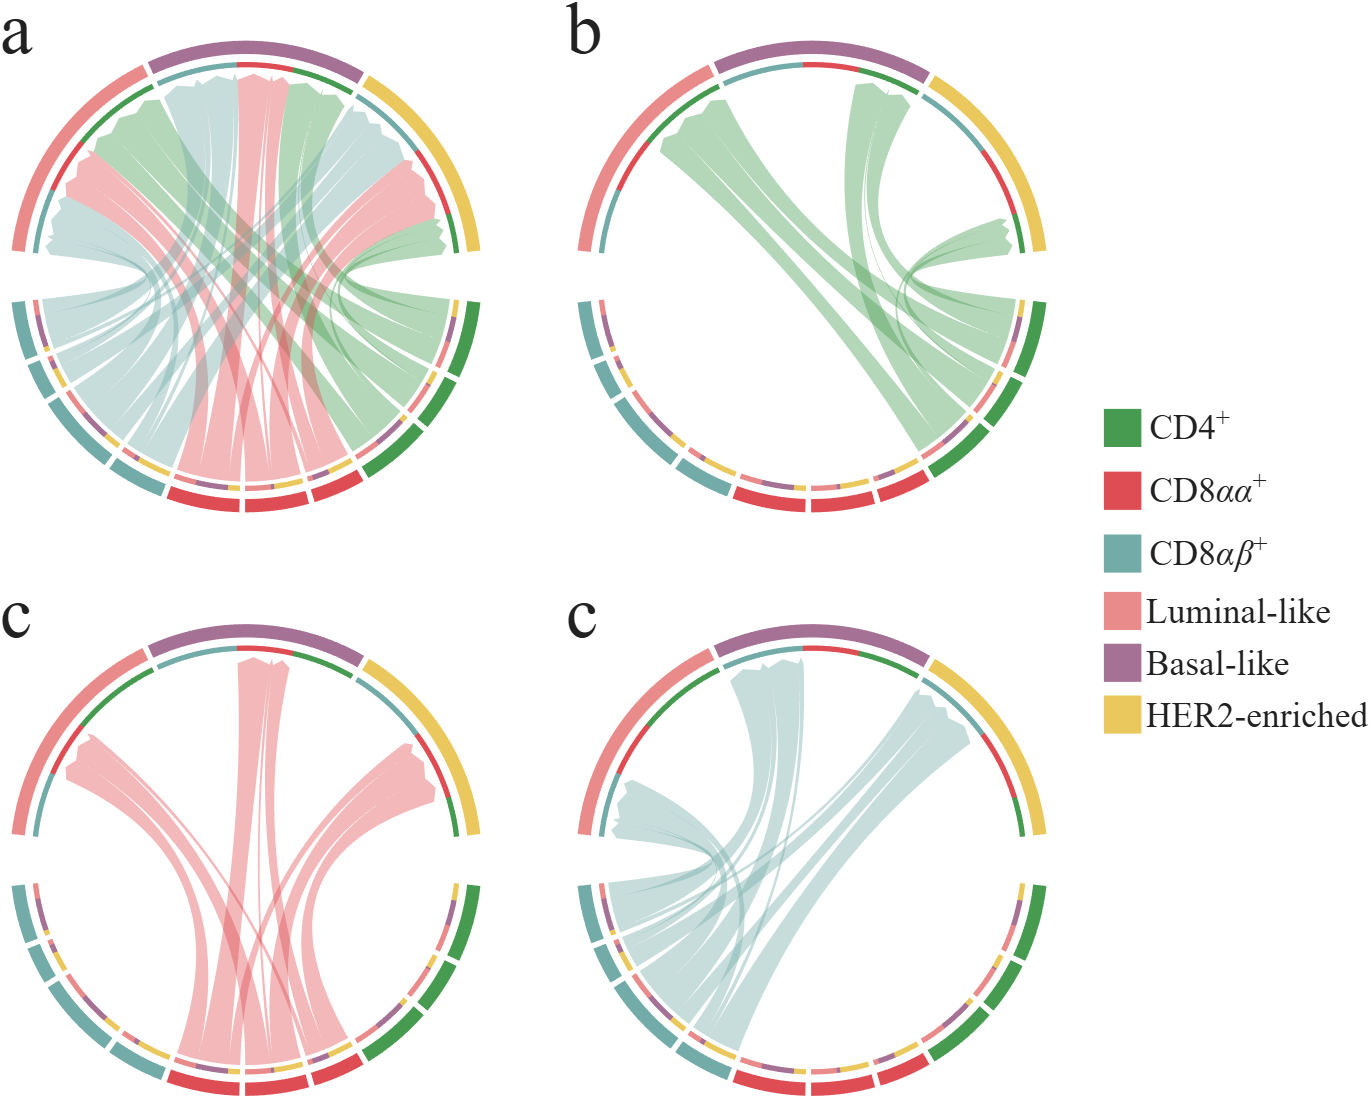
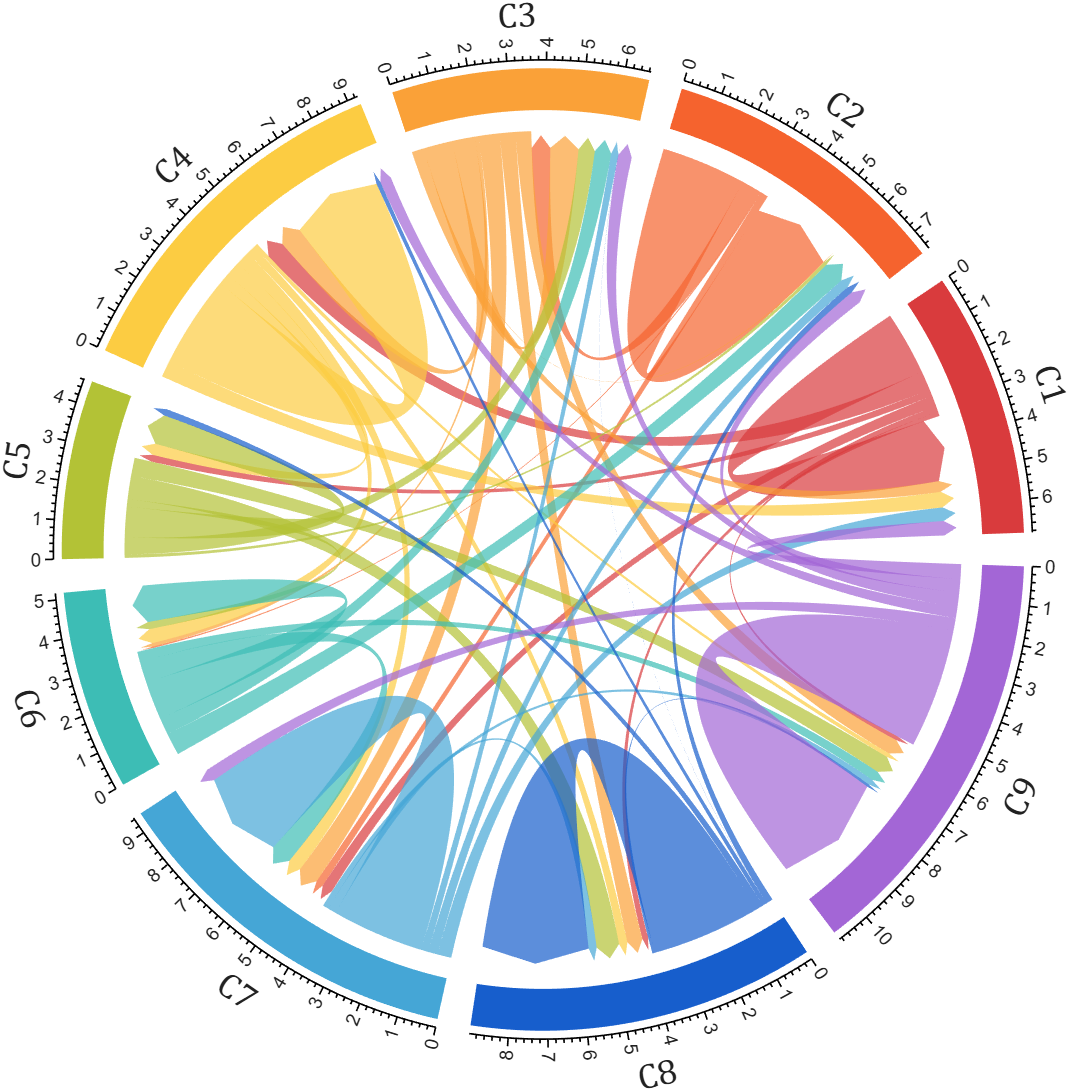
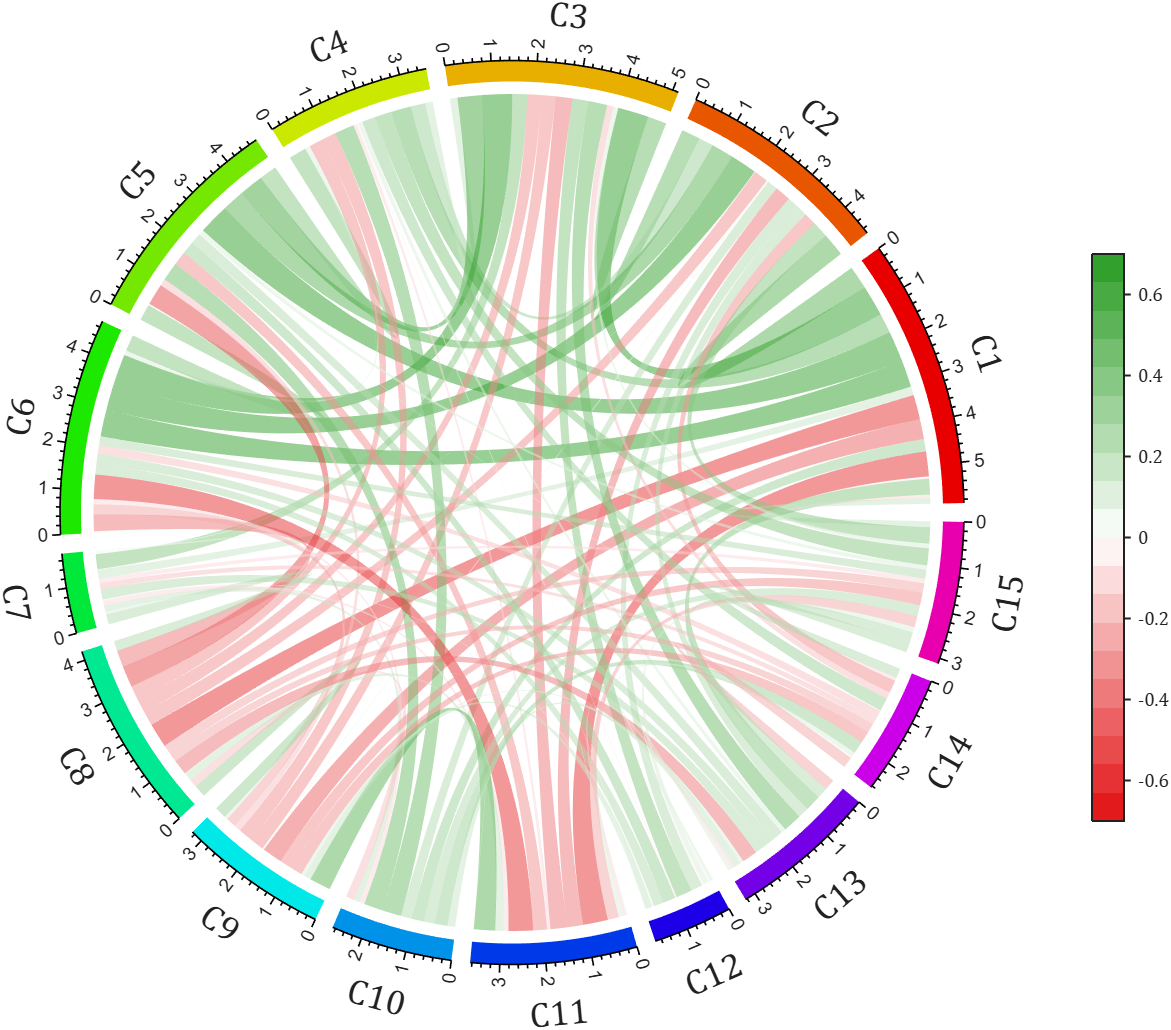
All figures presented in this Discussion were generated using MATLAB.
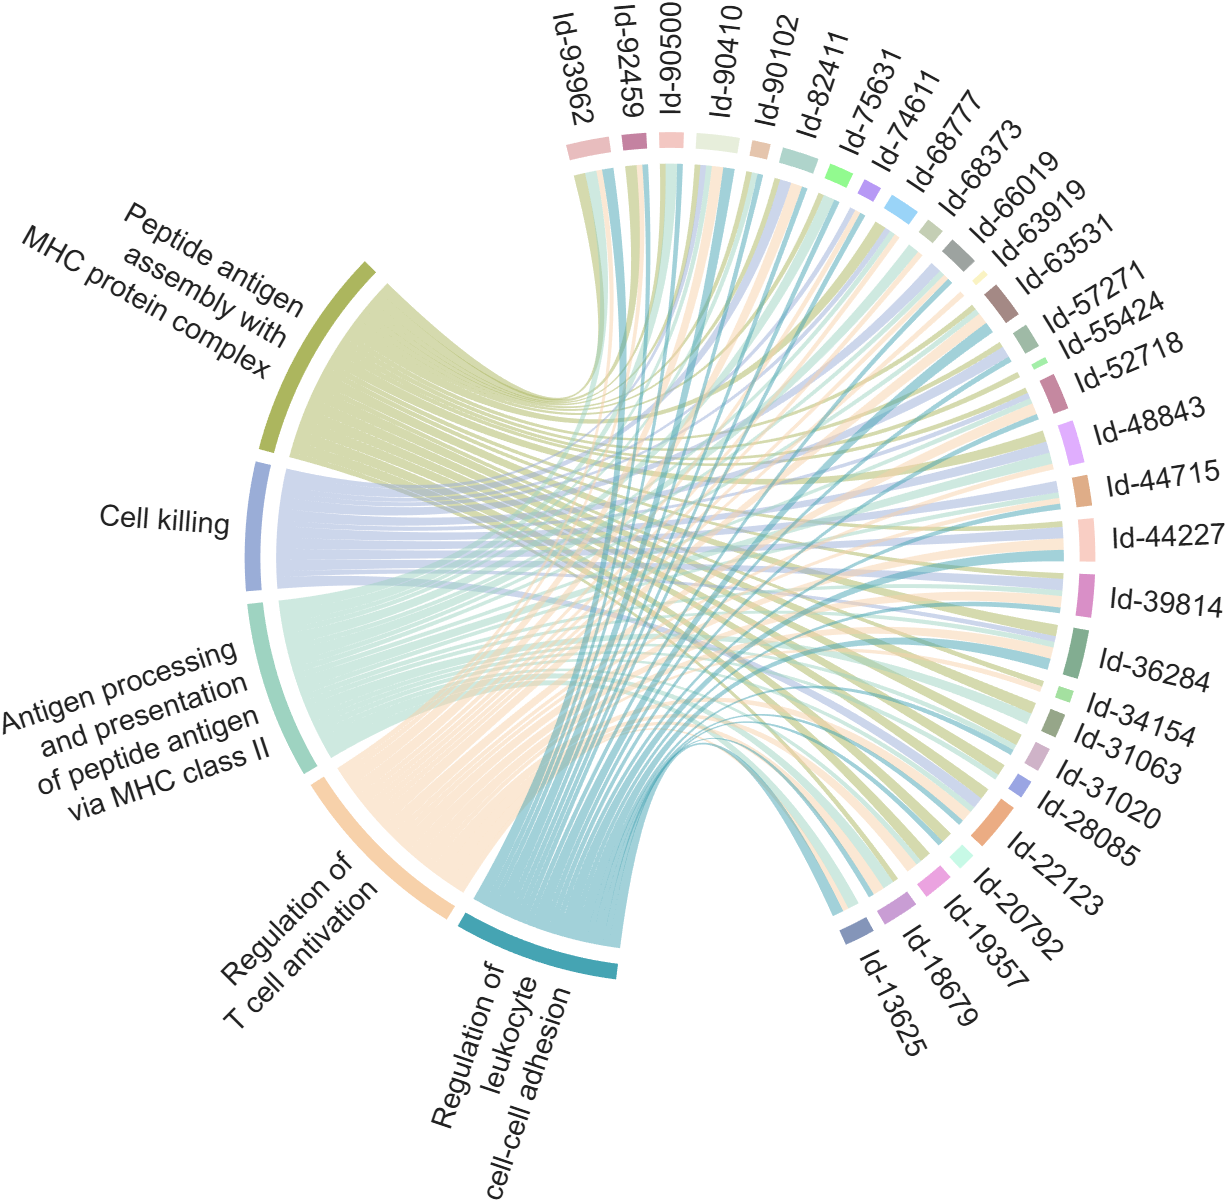
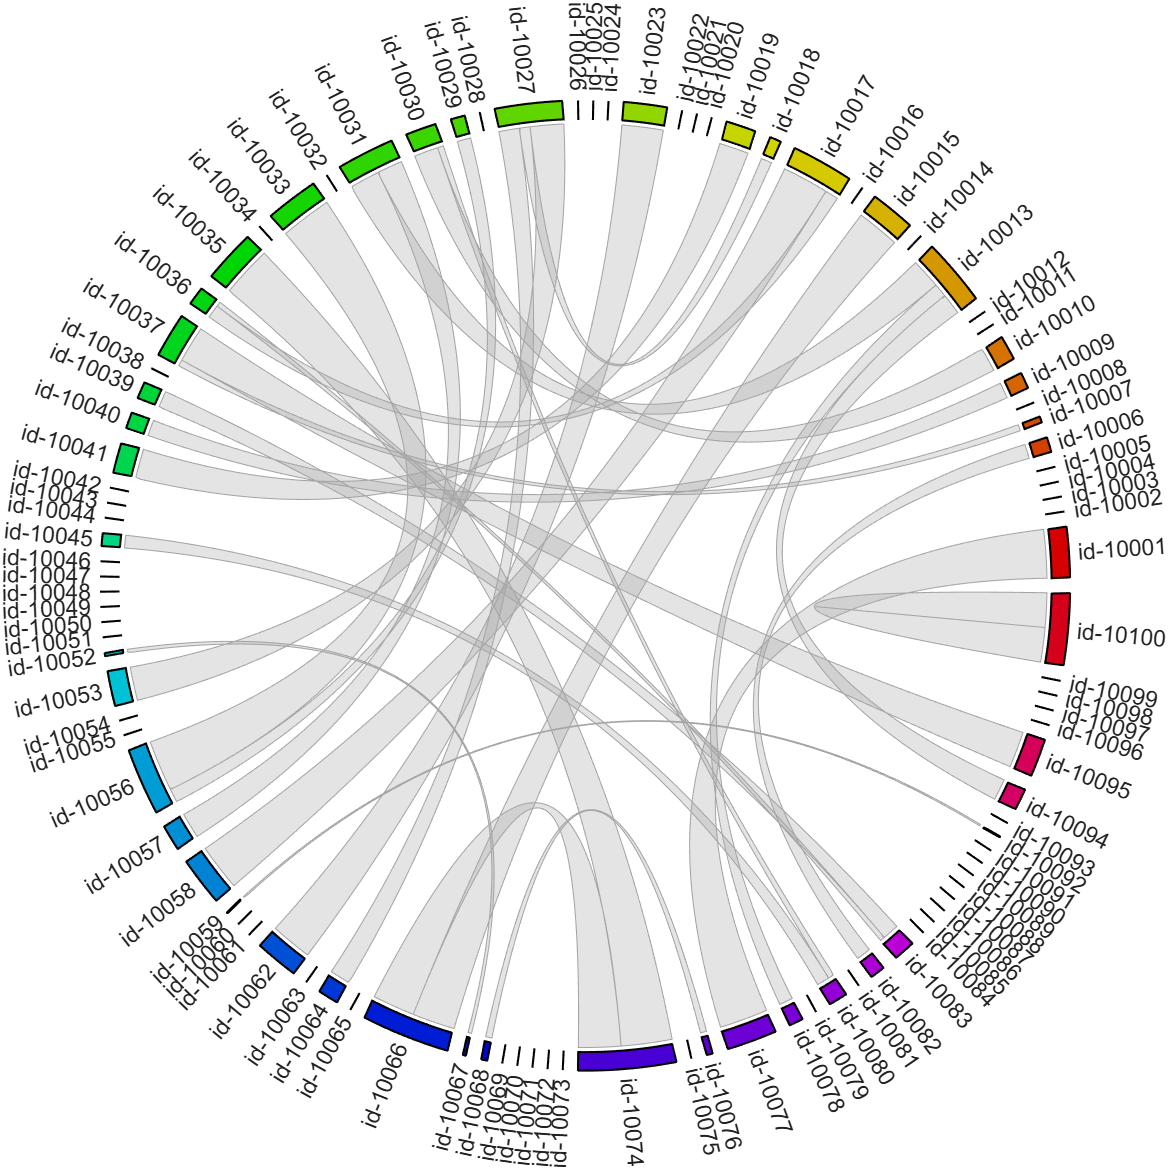
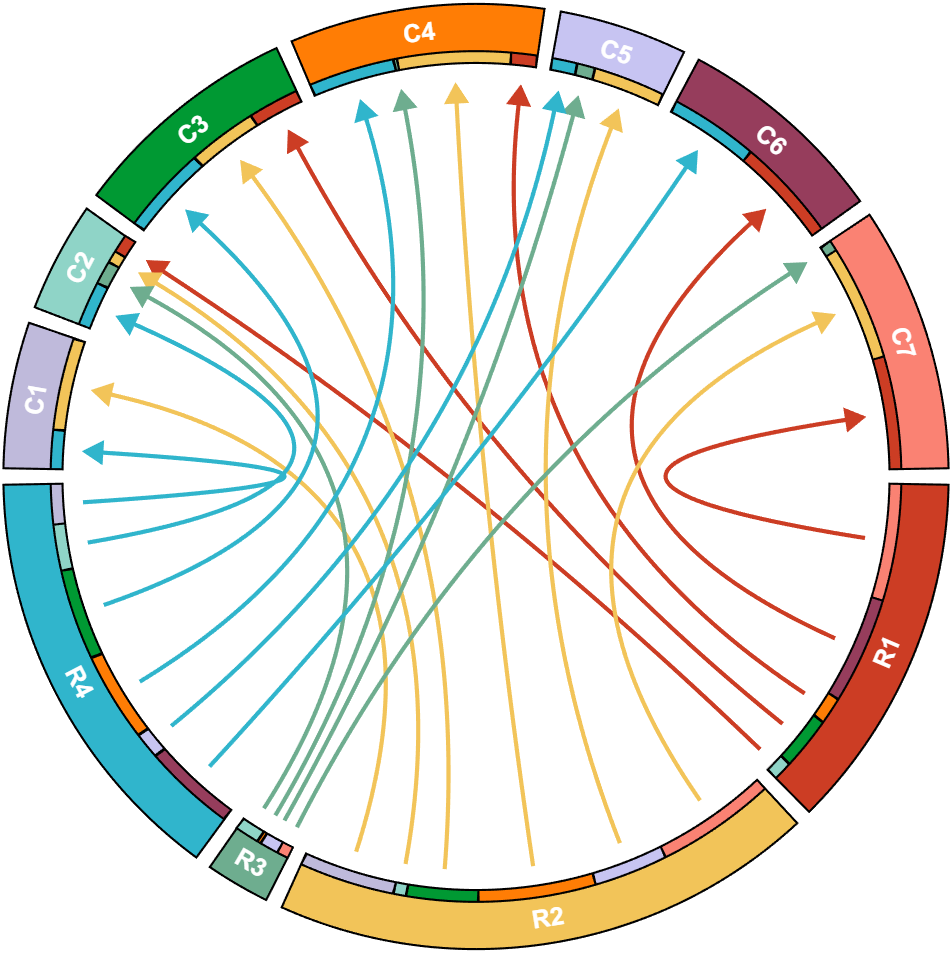
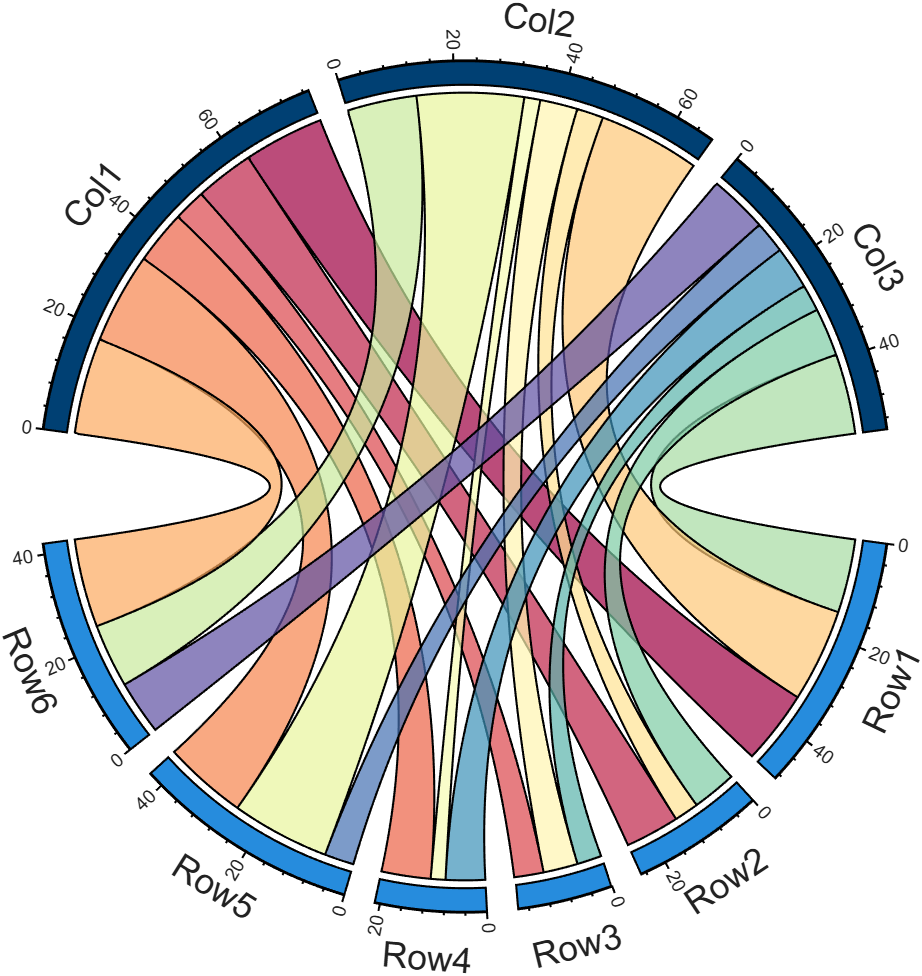
I developed two functions: one for plotting chord diagrams without self-loops, and the other for plotting chord diagrams with self-loops.
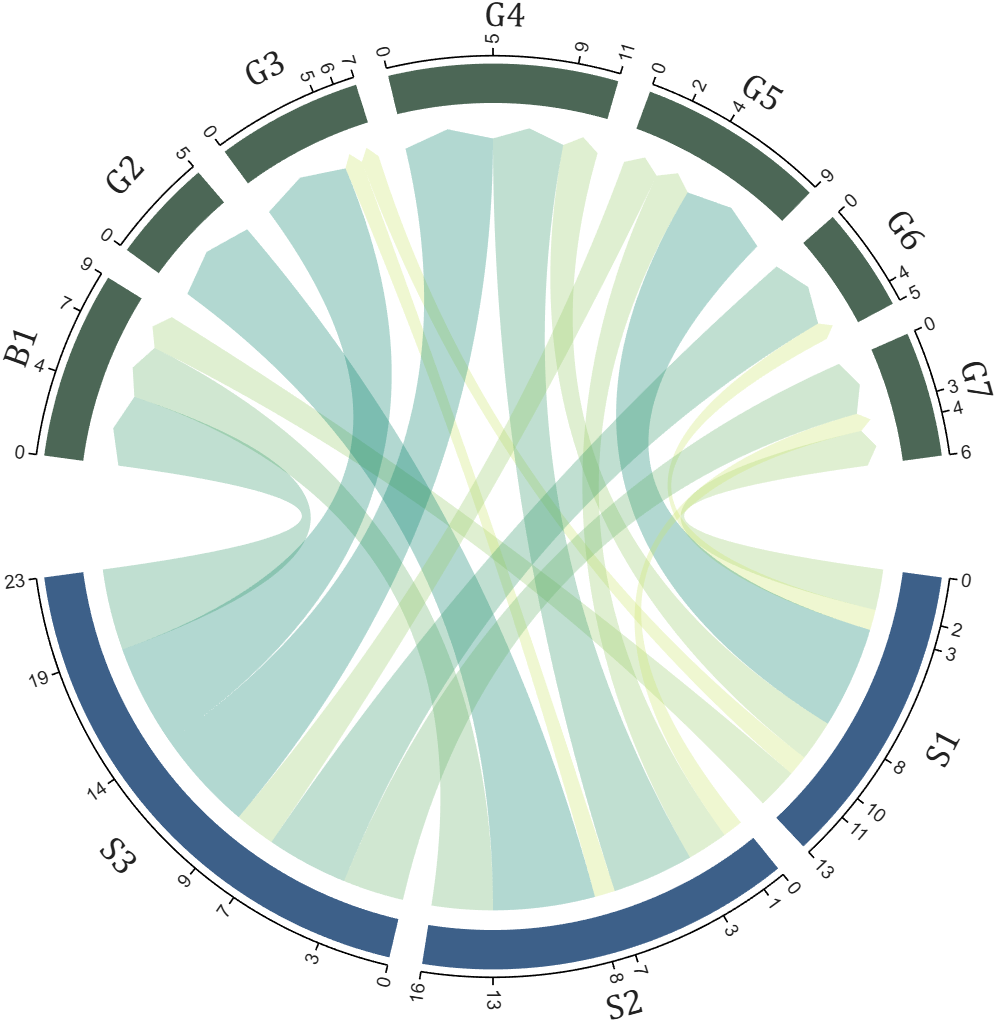
chordChart : basic usage
plotting chord diagrams without self-loops : https://www.mathworks.com/matlabcentral/fileexchange/116550-chordchart-chord-diagram
dataMat = [2 0 1 2 5 1 2;
3 5 1 4 2 0 1;
4 0 5 5 2 4 3];
colName = {'B1','G2','G3','G4','G5','G6','G7'};
rowName = {'S1','S2','S3'};
% Create and render chord diagram object (创建弦图对象并渲染)
CC = chordChart(dataMat, 'RowName',rowName, 'ColName',colName, 'Arrow','on');
CC.LinearMinorTick = 'on';
CC.draw();
% Set Font for labels and show ticks (调整字体并显示刻度)
CC.setFont('FontSize',17, 'FontName','Cambria')
CC.tickState('on')
CC.tickLabelState('on')
biChordChart : basic usage
plotting chord diagrams with self-loops : https://www.mathworks.com/matlabcentral/fileexchange/121043-bichordchart-bidirectional-chord-diagram
dataMat = randi([0,8], [5,5]);
nameList = {'AAA','BBB','CCC','DDD','EEE'};
% Create bichord chart object and draw (创建并绘制双向弦图对象)
BCC = biChordChart(dataMat, 'Arrow','on', 'Label',nameList);
BCC = BCC.draw();
% Show ticks and tick labels (添加刻度)
BCC.tickState('on')
BCC.tickLabelState('on')
% Set font properties (修改字体,字号及颜色)
BCC.setFont('FontName','Cambria','FontSize',17)
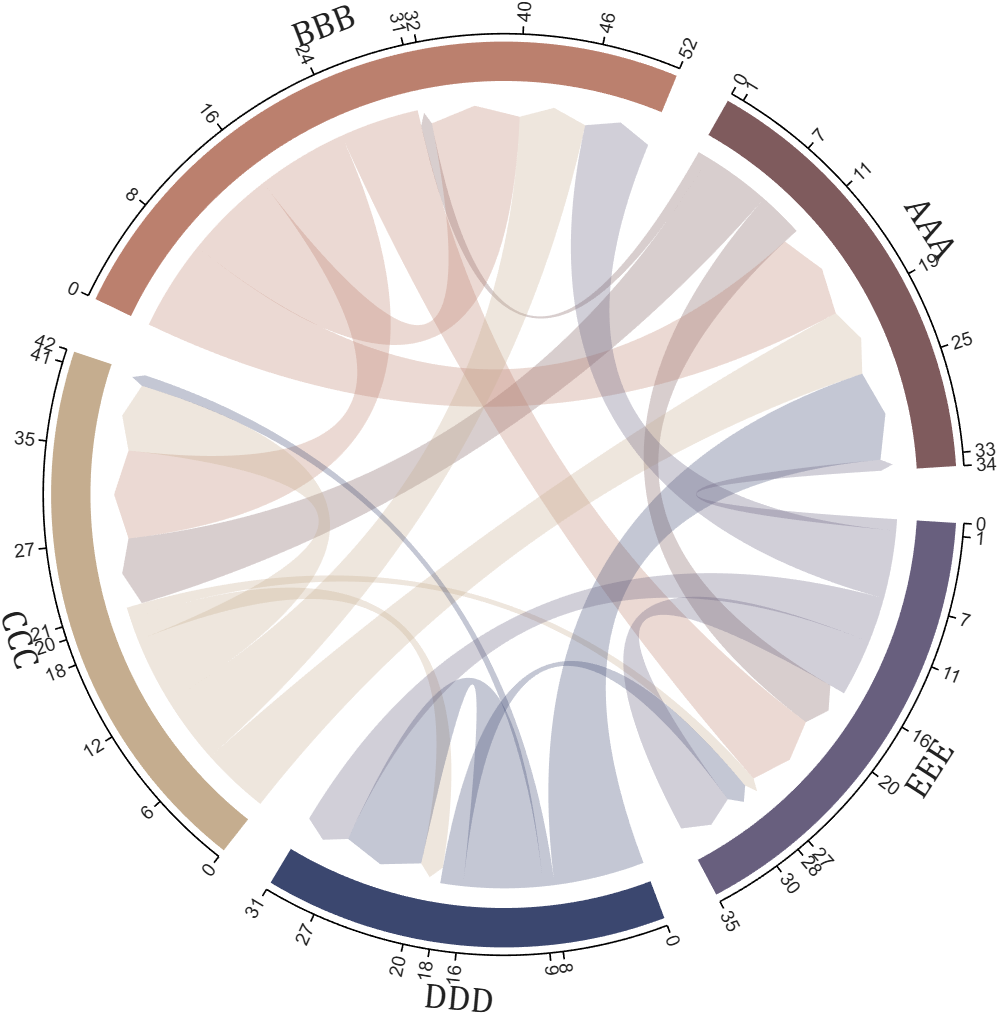
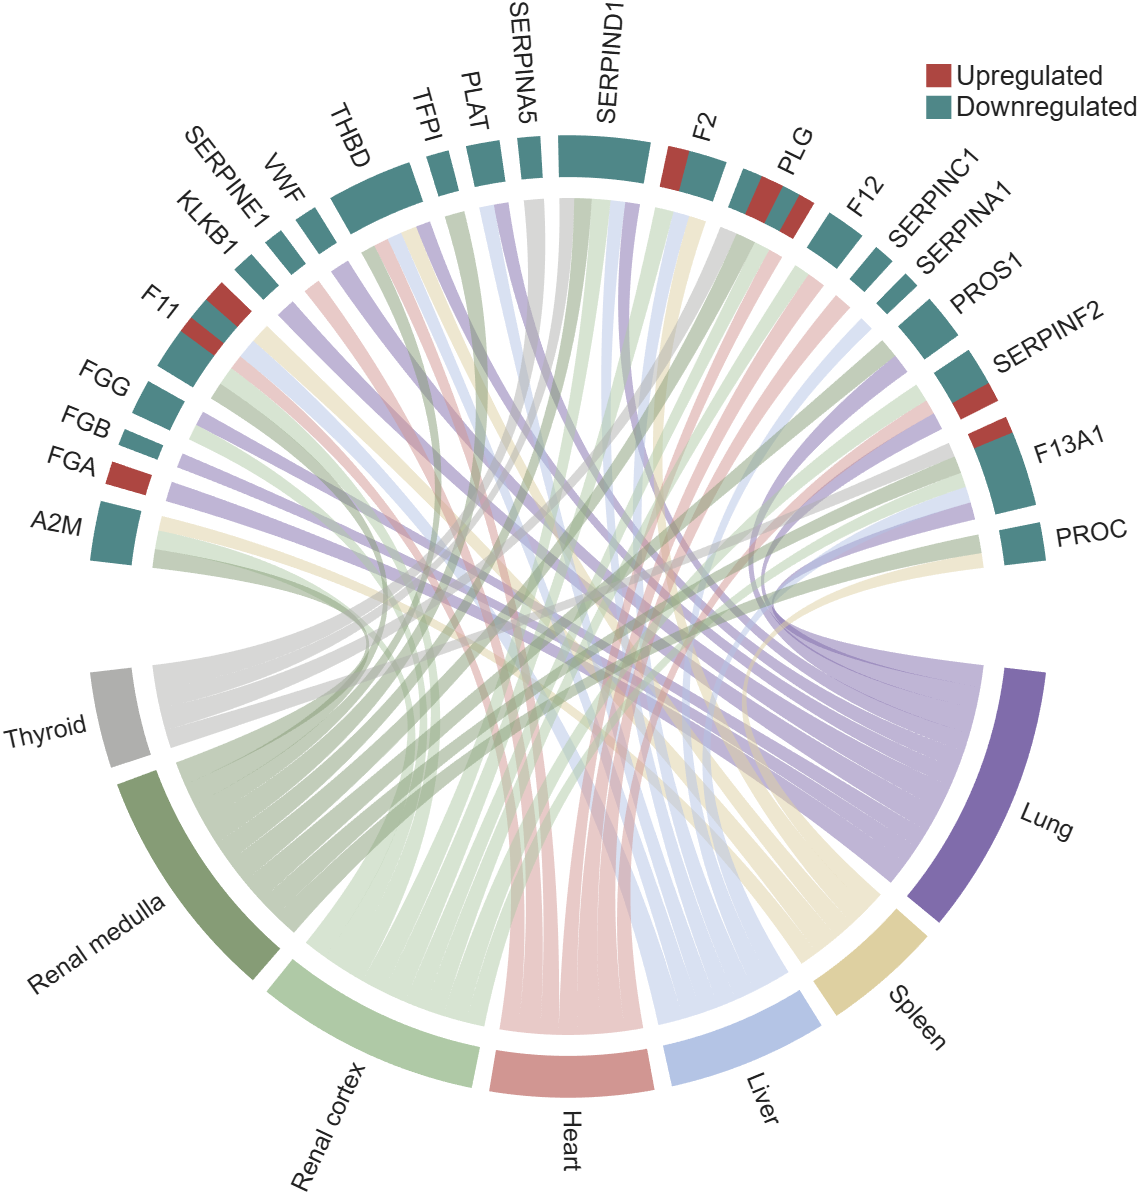
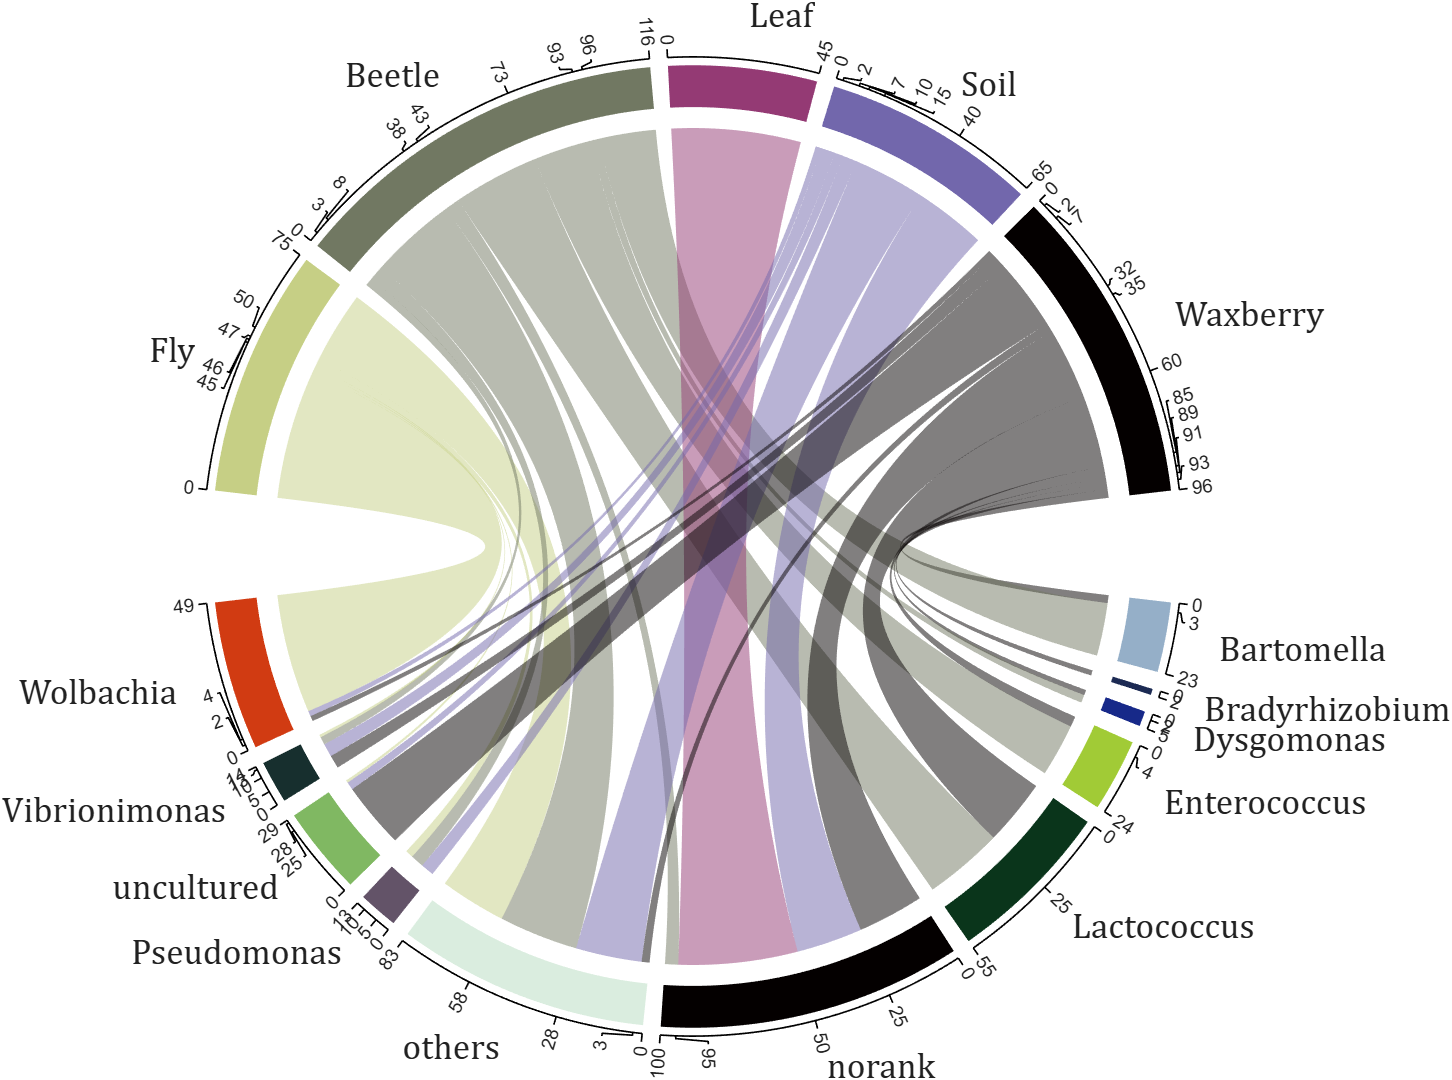
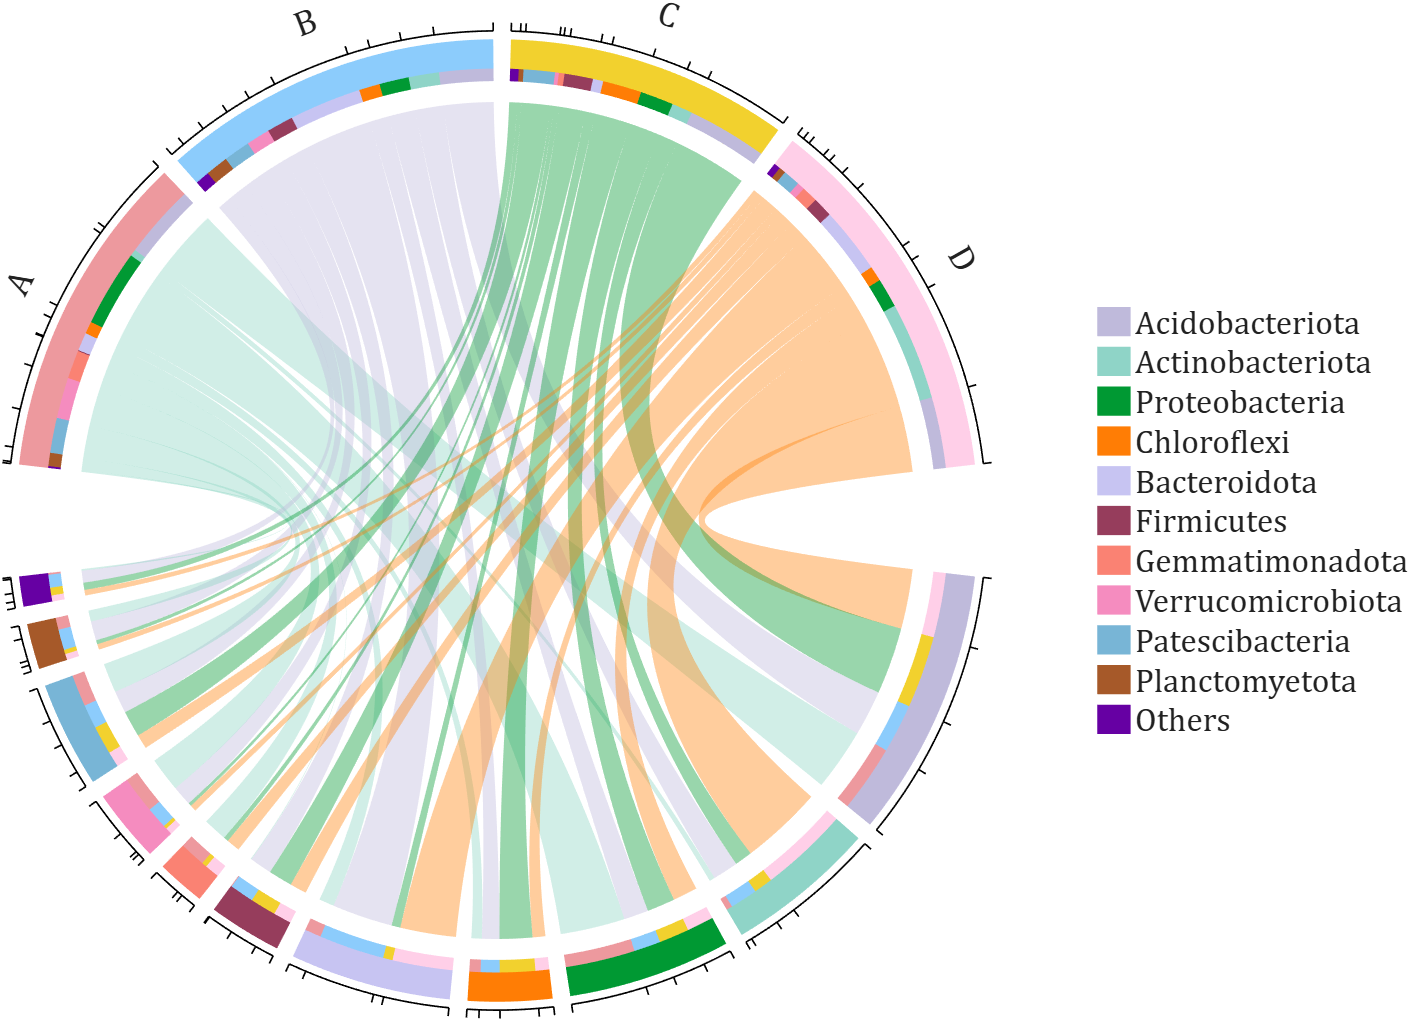
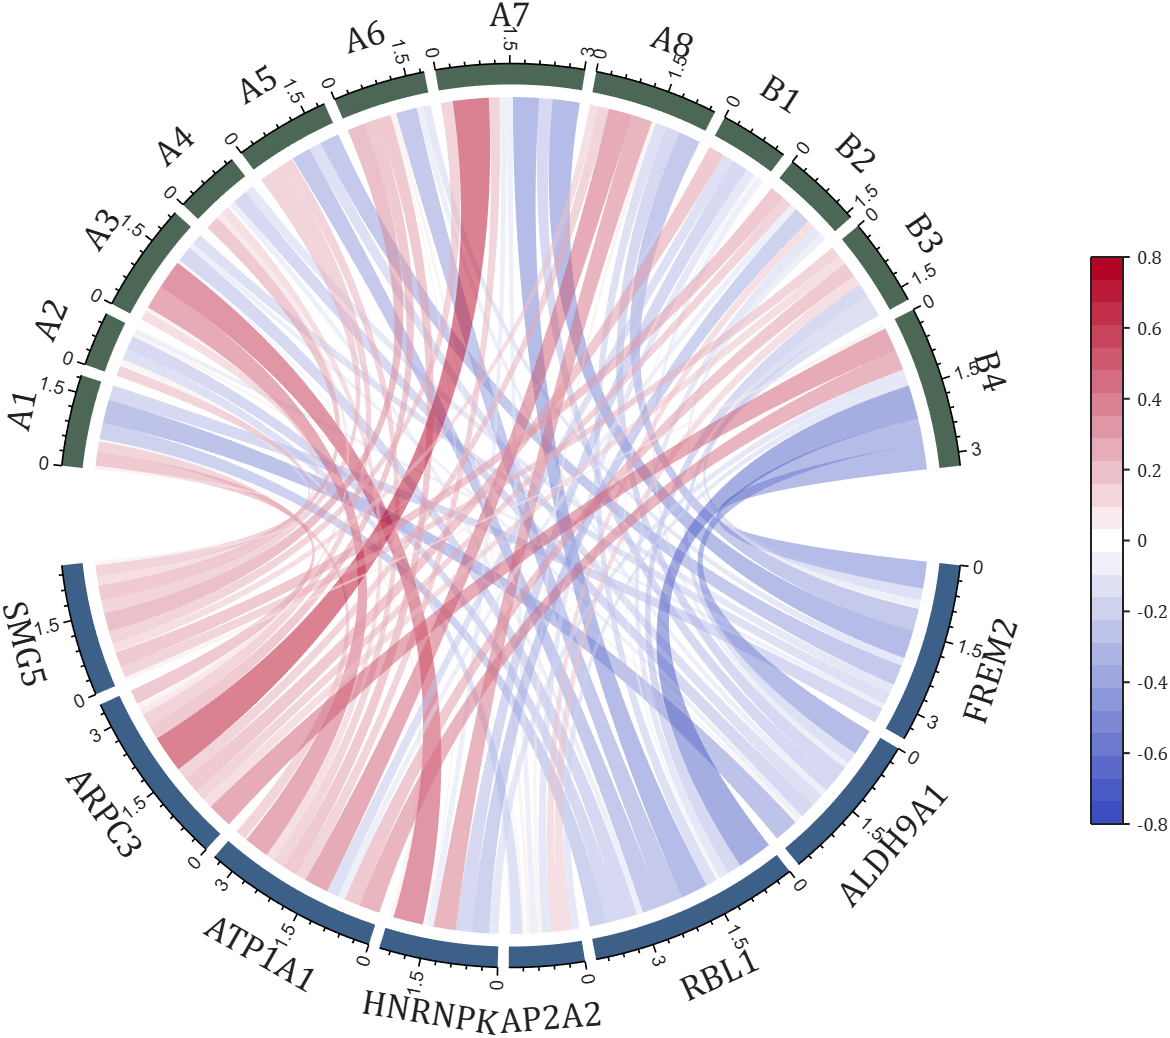
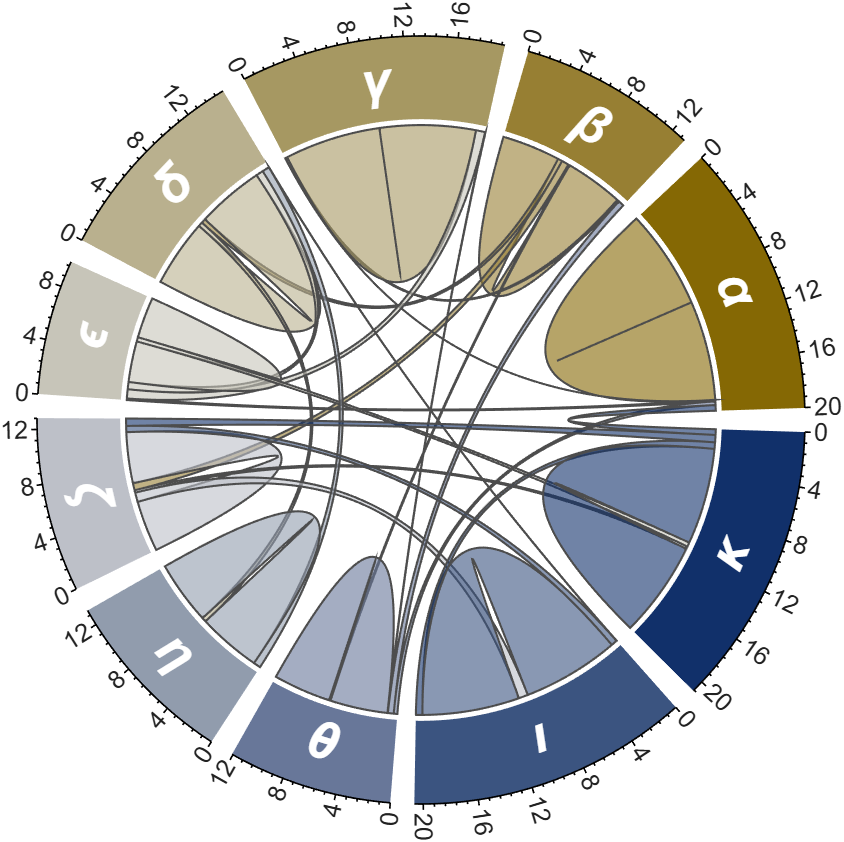
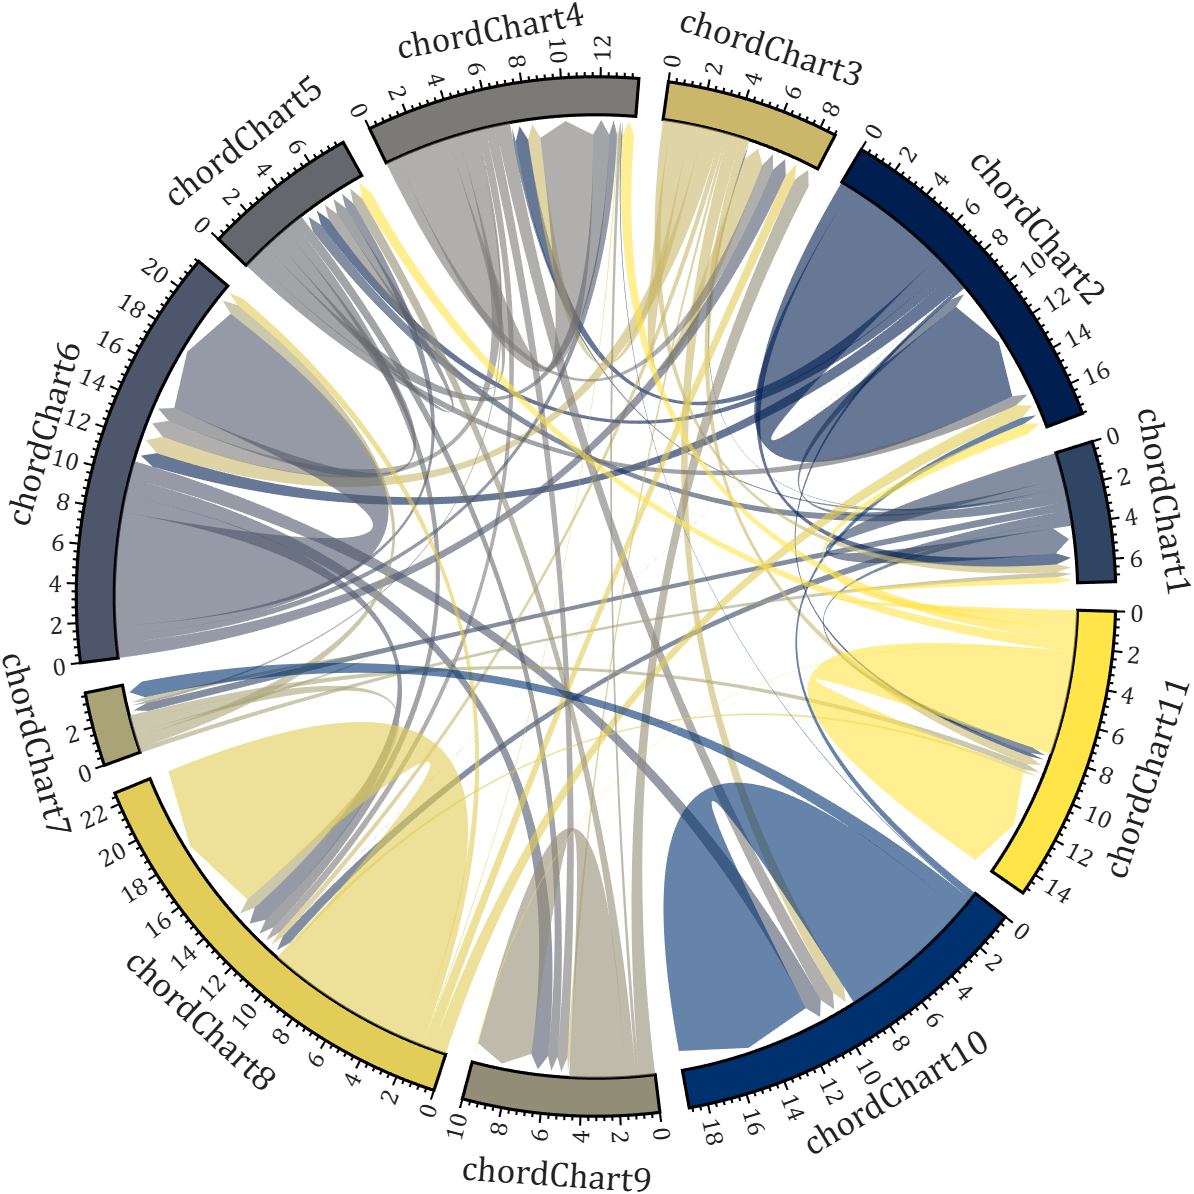
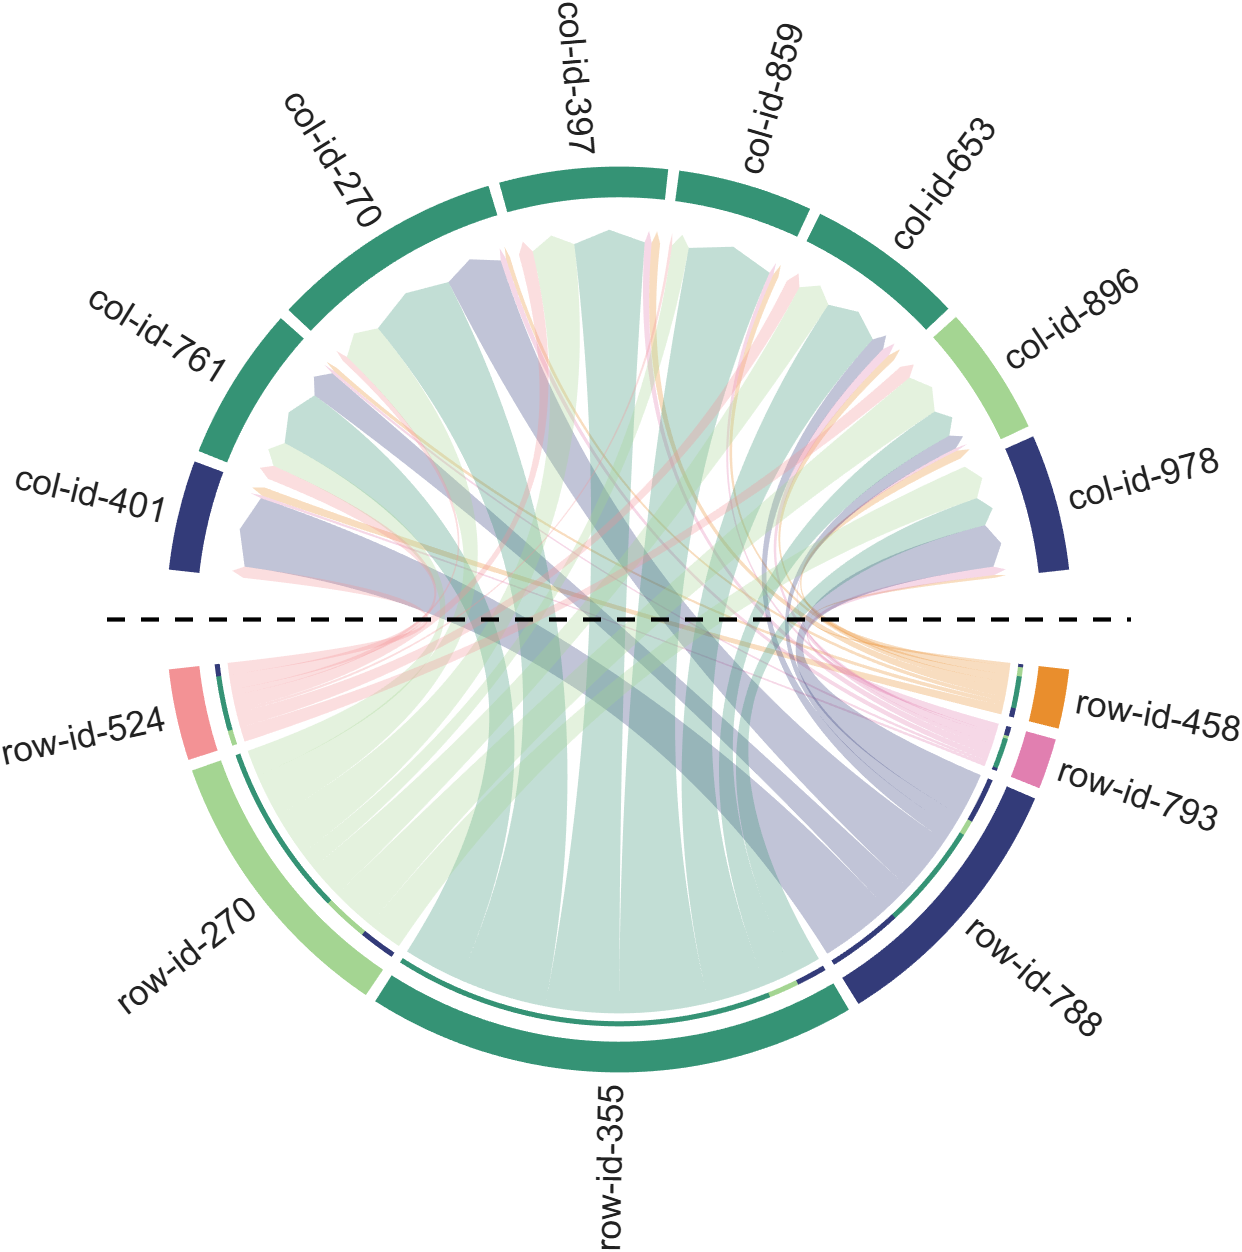
The two File Exchange submissions each provide more than a dozen basic examples. In addition, the GitHub repository listed below provides nearly 40 elaborate customized demonstration cases.

How does MATLAB ThingSpeak Work ?

Hallo zusammen,
Ich habe einen Frage zu meinen Programm. Dies will einfach nicht laufen und ich finde keinen Fehler mehr. Ich habe mein Programm bei Simulink geschriebenen den Code bei Maltab Function. Das Board ist ein Adruino Uni Board. Ein Ultrasonic Sensor soll die Füllstände ich Wäschekörben messen. Dabei wird unter voll oder halbvoll entschieden. Anschließend wird ein Motor angesprochen, der entweder 15 oder 30 Sekunden laufen soll. Überwacht wird der Motor von einem Thermistor (den habe ich hier PT100 genannt) und einen Vibrationsschalter. Dazu soll der Vibrationsschalter über einen Resetknopf zurückgesetzt werden. Ich hoffe ihr könnt mir weiterhelfen.
Vielen Dank:)
if true
% code
end

n= input('Escolhe um número inteiro postivo. ')
primo=true;
i=2;
while i<n
if mod(n,i)==0;
primo=false;
end
i= i+1;
end
if primo && n>1;
disp('É primo')
else
disp('Não é primo')
end
anterior= n-1;
while true
primo=true;
i=2;
while i< anterior
if mod(anterior,i)==0;
primo= false;
end
i= i+1;
end
if primo && anterior>1;
end
anterior= anterior-1;
end
disp(anterior)
seguinte= n+1;
while true;
primo= true;
i=2;
while i<seguinte;
if mod(seguinte,i)==0;
primo=false;
end
i=i+1;
end
if primo && seguinte>1;
end
seguinte= seguinte+1;
end
disp(seguinte)
Any ideas? It is in portuguese if you intend to translate it.
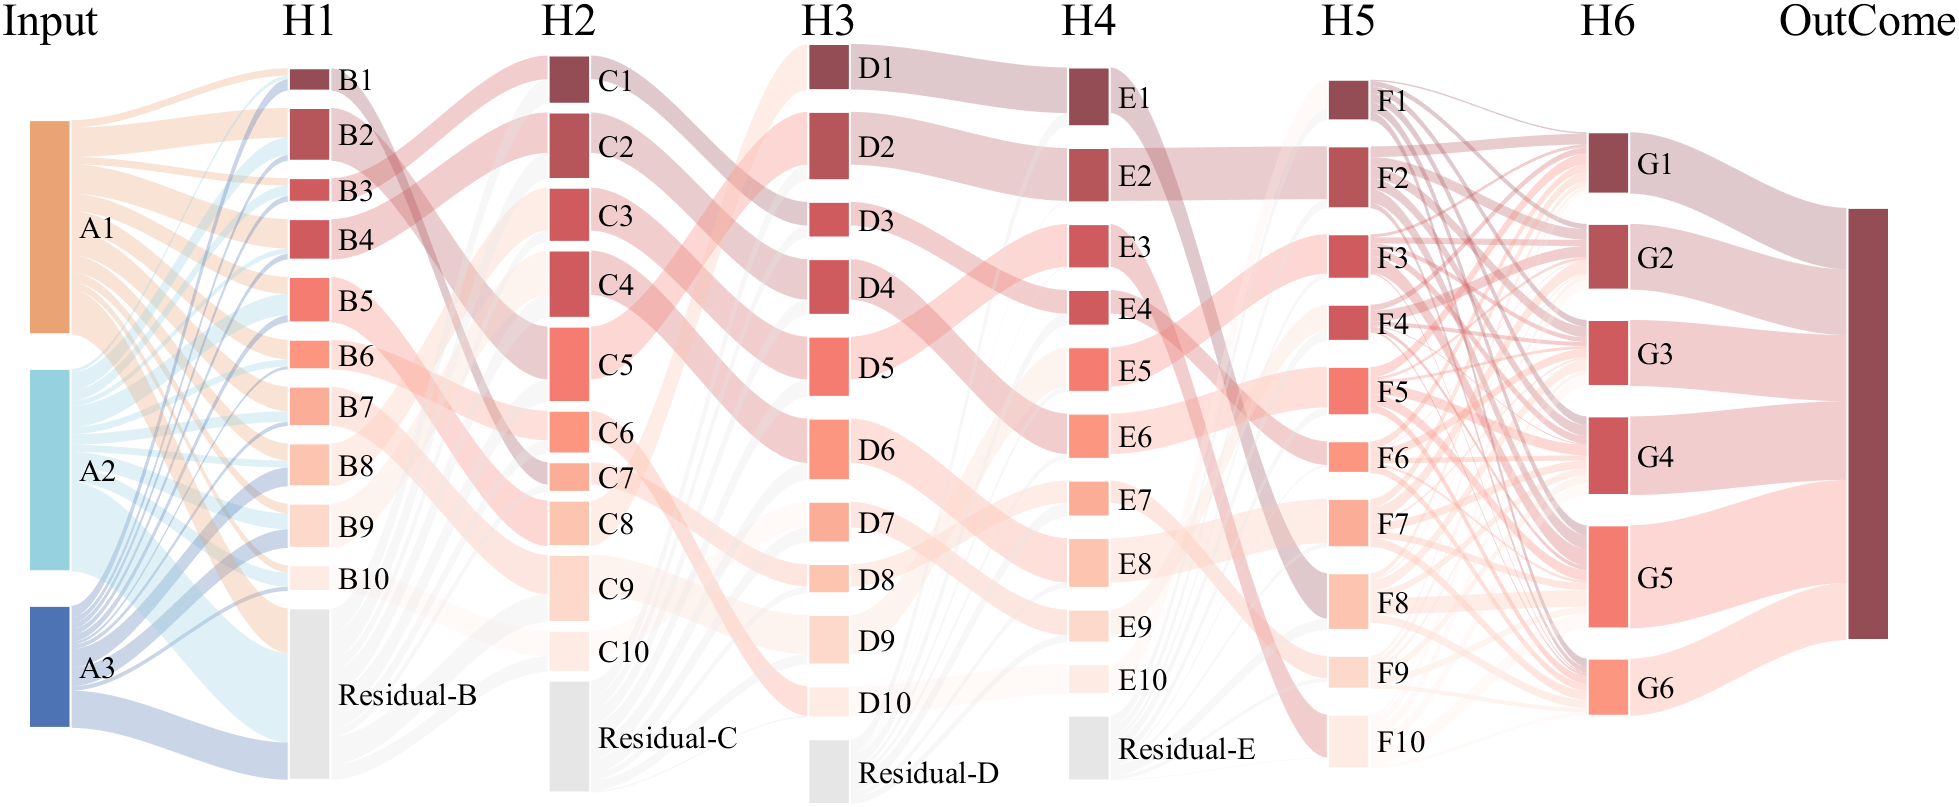
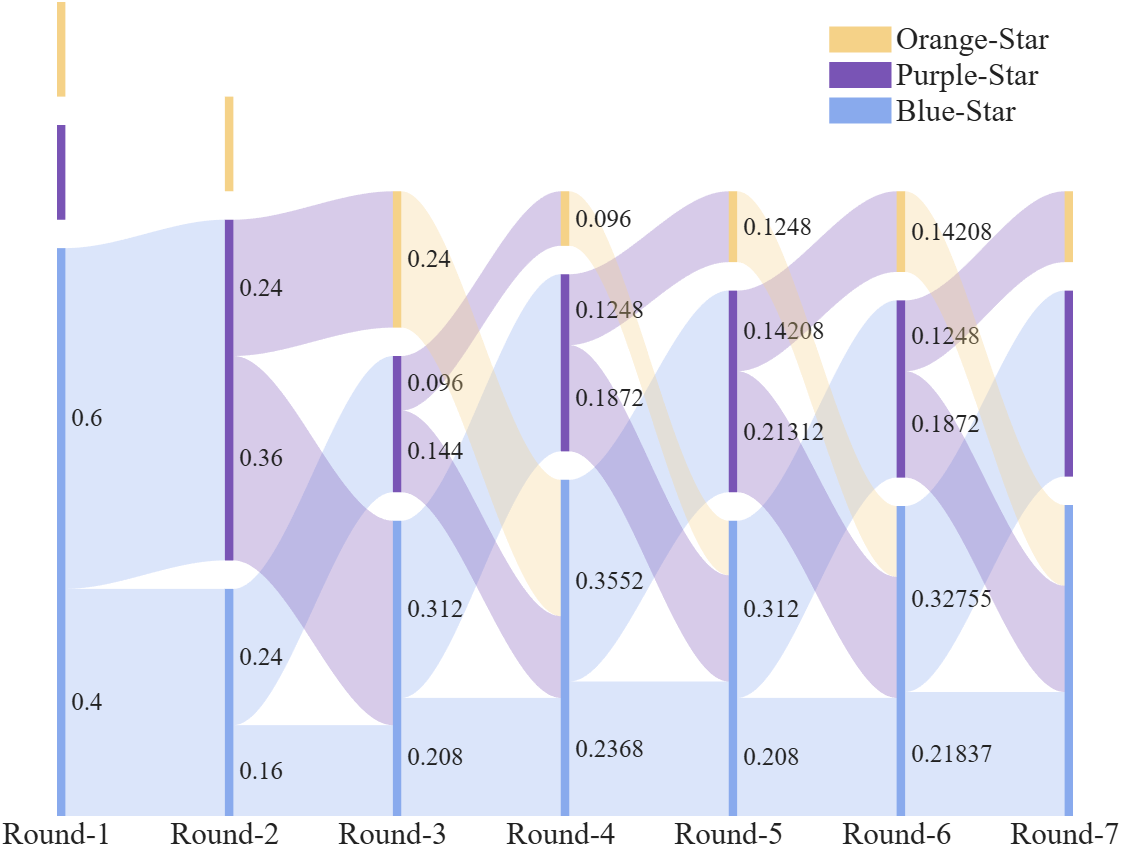
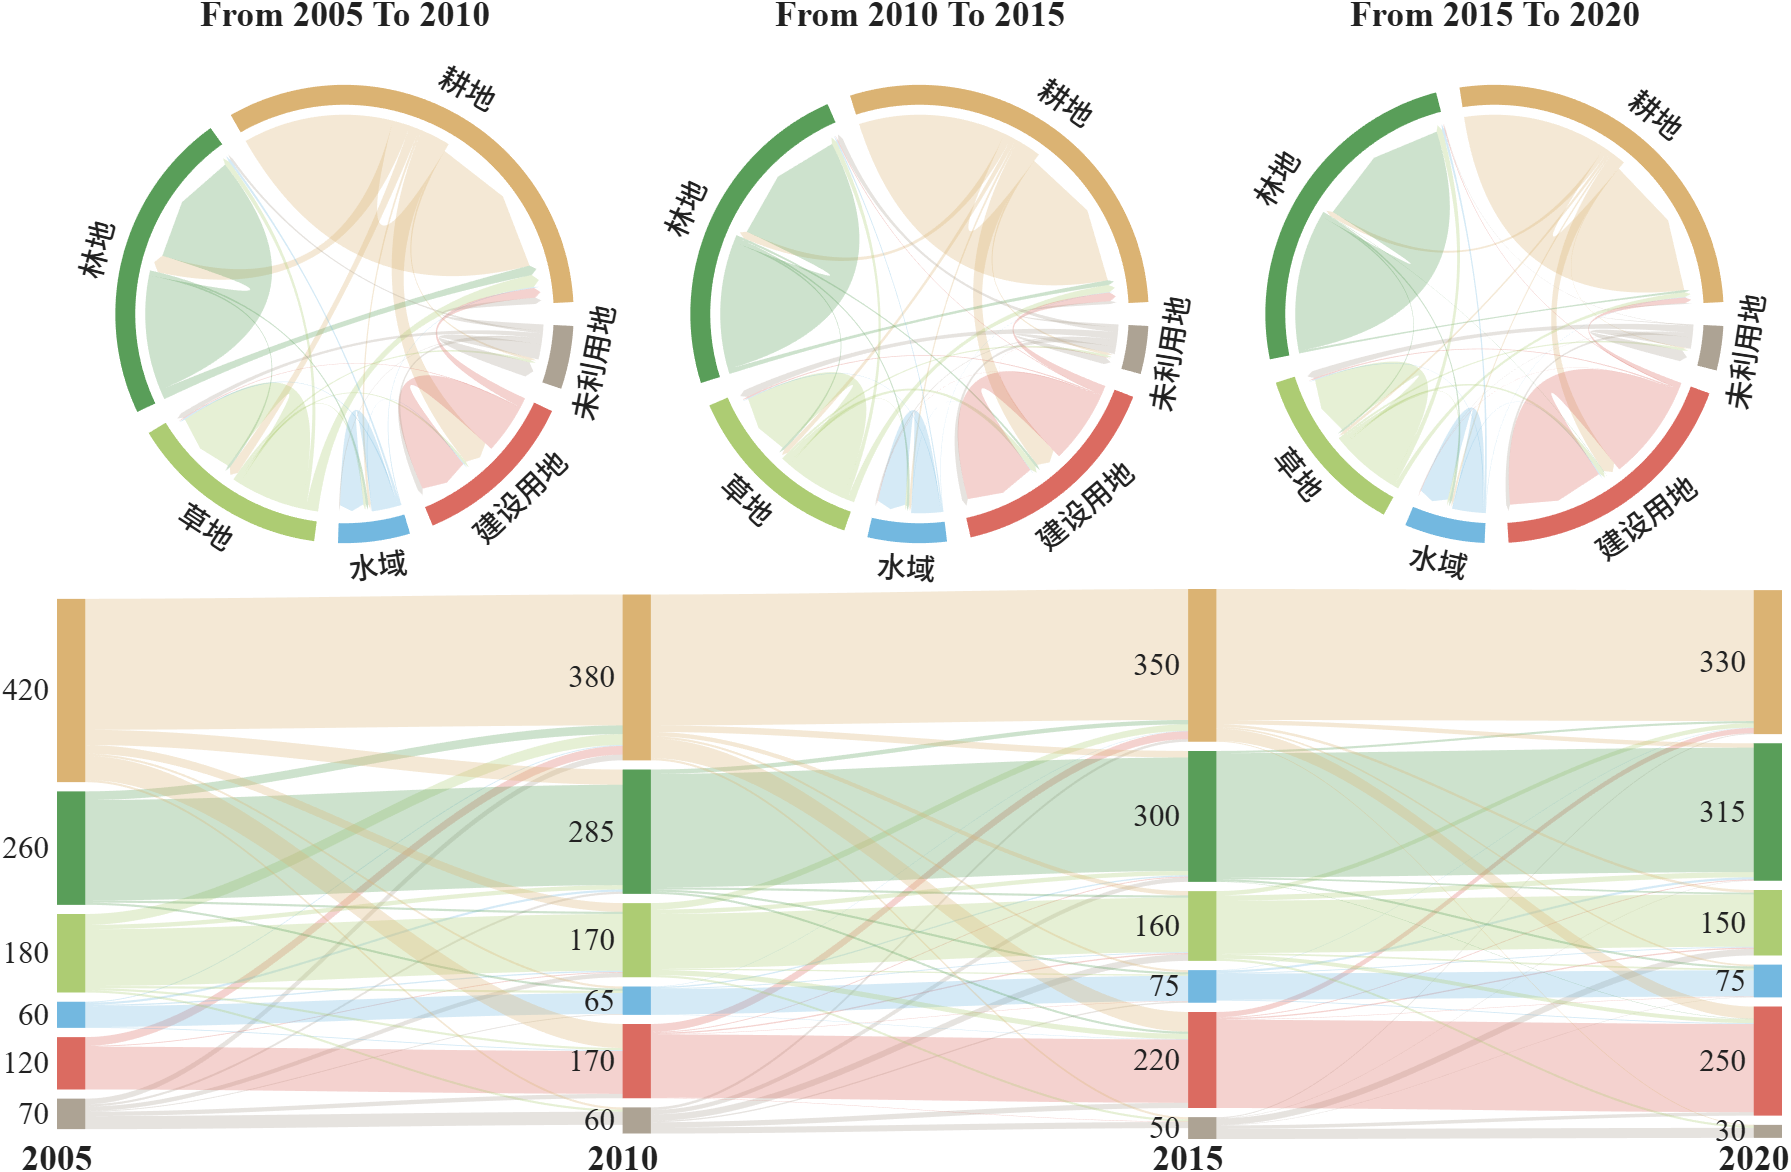
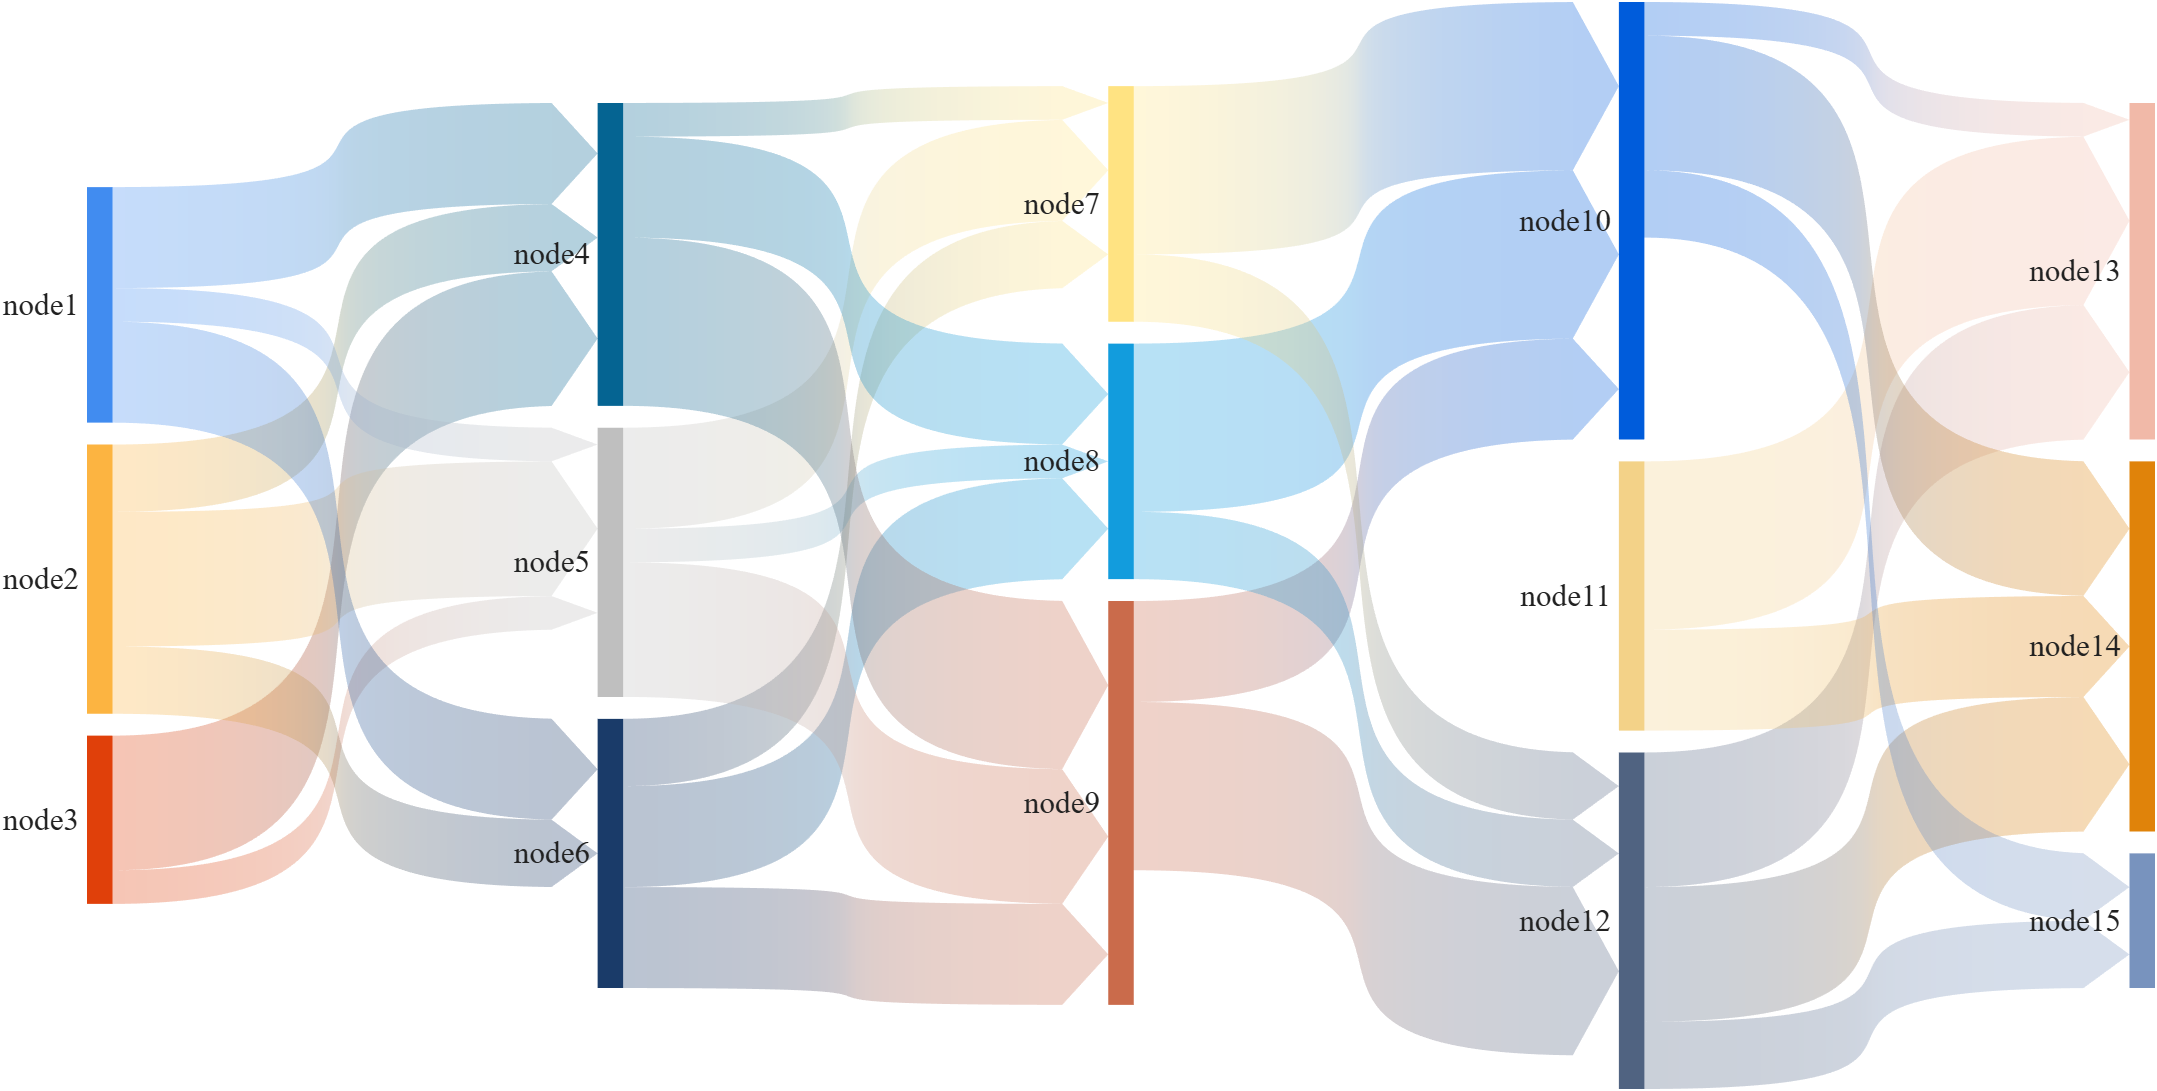
This is a brief introduction and recommendation of a Sankey diagram plotting tool:
Basic usage - links
links={'a1','A',1.2;'a2','A',1;'a1','B',.6;'a3','A',1; 'a3','C',0.5;
'b1','B',.4; 'b2','B',1;'b3','B',1; 'c1','C',1;
'c2','C',1; 'c3','C',1;'A','AA',2; 'A','BB',1.2;
'B','BB',1.5; 'B','AA',1.5; 'C','BB',2.3; 'C','AA',1.2};
% 创建桑基图对象(Create a Sankey diagram object)
SK=SSankey(links(:,1),links(:,2),links(:,3));
% 开始绘图(Start drawing)
SK.draw()
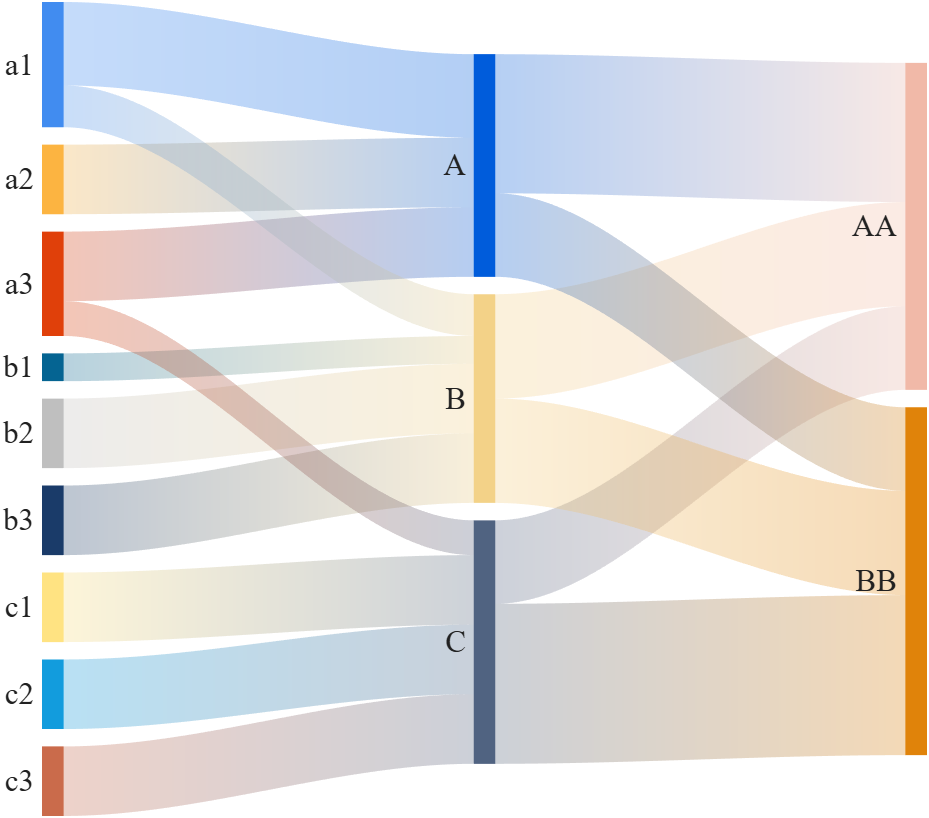
Basic usage - adjMat
% Define inter-layer adjacency matrices
% 定义层间邻接矩阵
A12 = [1,2,1; 1,2,3; 2,0,1];
A23 = [1,4; 2,1; 0,3];
A34 = [1,5; 2,3];
% Assemble global block matrix (main diagonal = zero, super-diagonal = A12, A23, A34)
% 组装全局分块矩阵(主对角线为零,上对角线为 A12, A23, A34)
adjMat = mergeAdjMat({A12, A23, A34});
SK = SSankey([],[],[], 'AdjMat',adjMat);
SK.draw()
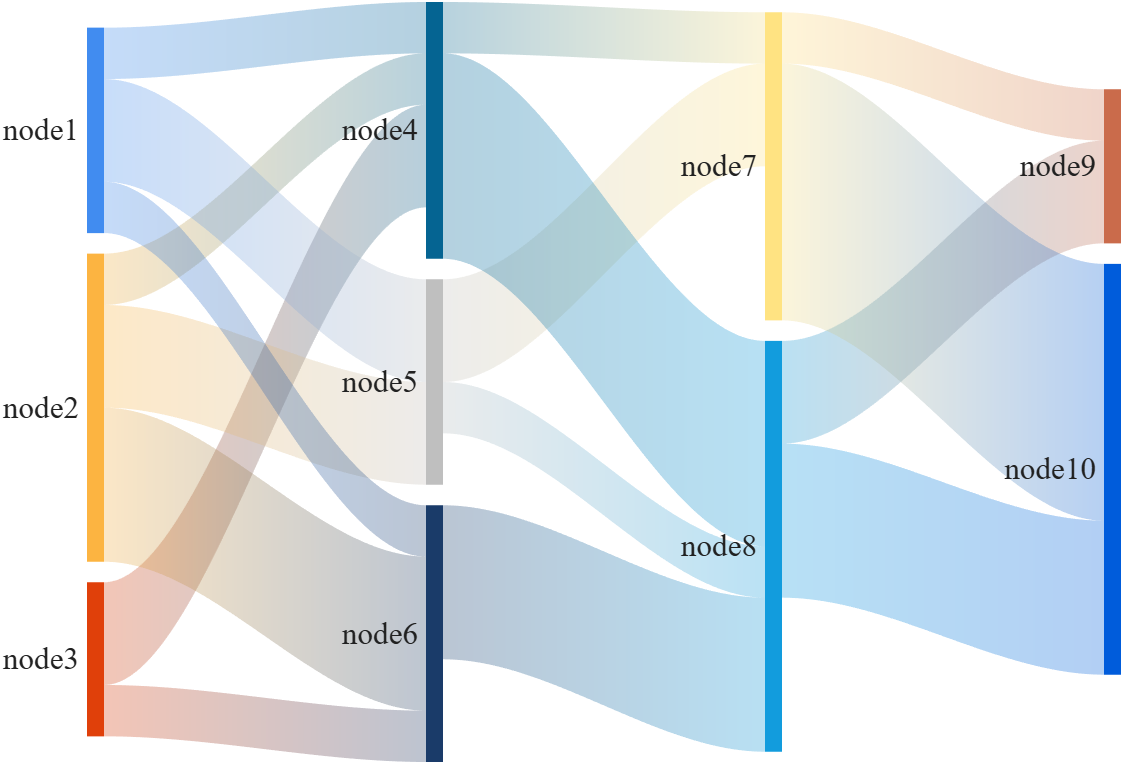
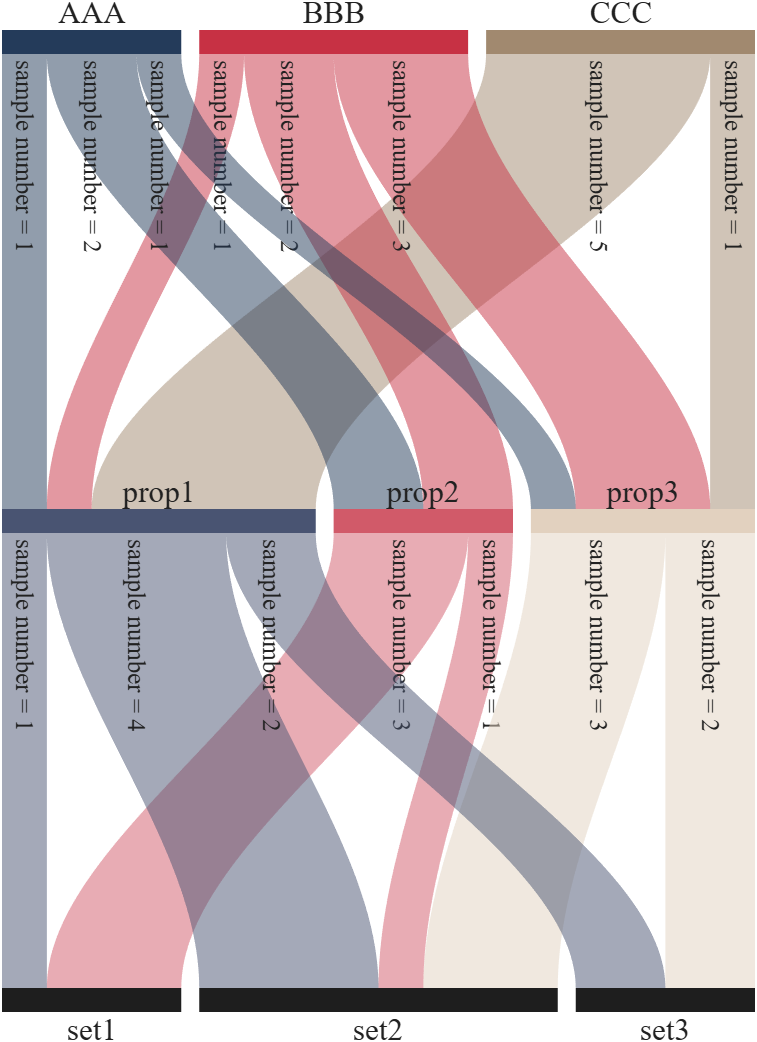
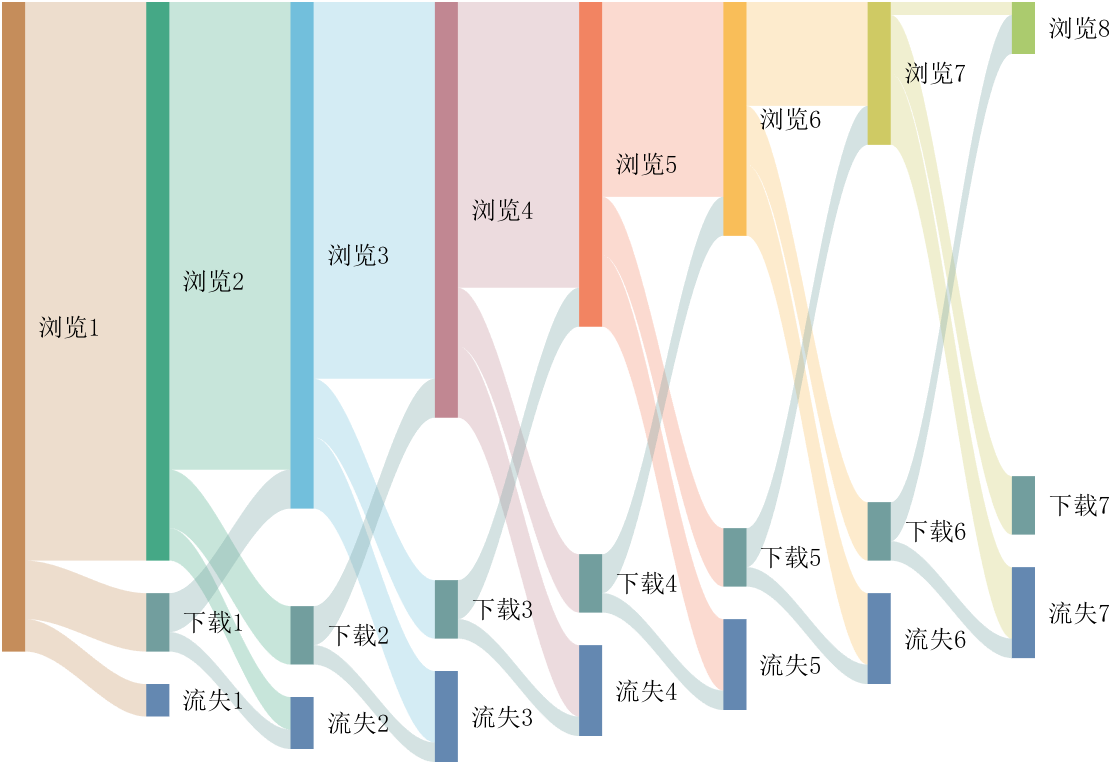
Further usage examples can be found in the demos included in the compressed package:

I've been confused trying to write (or have an AI write) the .m (Live) text format from scratch for various reasons using .mlx format exported with the IDE as .m (old) and .m (LIve). Of course, one problem is the .m and .m (Live) files have the same name,causing confusion and requiring renaming, but repeatedly, after sussing out and following all conventions for headings and latex etc in .m (LIve), my .m (Live) files would not open as .mlx in the IDE. I think I've found the answer by trial and error and comparison and don't know it is documented. Add at the end
%[appendix]{"version":"1.0"} %--- %[metadata:view] % data: {"layout":"inline"} %---
This seems to trigger the IDE to recognize this is a .m (Live). Woohoo! This is a LOT easier than writing .mlx zip packages from scratch.

Have there been some changes made to the ThinkSpeak graphs? I am unable to change the number of days displayed, nor the number of data points to display. I did have them display 5 days, but now they are showing 14 days even though the setting is 5. I tried logging out and back in, but to no avail. Thanks.

talks about how GeForce has become deprioritized by Nvidia, and
The chatter from the grapevine is that we won't see any new GPUs from Nvidia this
year at all — not one — and that's very rare (in fact it hasn't happened in three
decades). This is because Nvidia needs all the chips it can get — and perhaps more
to the point, all the video RAM — for AI graphics cards which are far more
profitable than consumer models.
Soon, Mathworks will be facing a choice: continue to support only expensive Nvidia AI offerings -- or diversify to support alternative GPUs as well.
By the way: Nvidia AI units cost $US7.8 million dollars. https://www.tomshardware.com/tech-industry/artificial-intelligence/nvidias-memory-costs-soar-485-percent-latest-ai-systems-now-cost-usd7-8-million-to-build-memory-now-comprises-25-percent-of-the-total-cost-rubin-gpus-a-mere-usd50-000-apiece
Which alternative GPUs would you most like to see supported?
- Unfortunately, I hear that Apple provides poor support for information on really using their "silicon" GPUs in any way other than Apple's pre-packaged computation libraries. The Apple attitude is apparently that anything that is not already nailed down by documentation is fair game for changing in the future, and that documenting how the GPUs really work would constitute nailing them down, supposedly "destroying" Apple's creativity. Exception: Apple is known to work with major gaming studios (but only the major ones.)
- The Apple silicon series of GPU does not provide any 64 bit operations, so 64 bit support would require emulating 64 bits in software. Nvidia is famous for internally implementing 64 bit support in terms of 32 bit operations, at 1:32 of the speed -- but on the other hand select Nvidia devices operate 64 bit operations at 1:24 or even 1:8 (a small number of devices) through hardware acceleration units. People who need 64 bit operations have the option of shopping very carefully in Nvidia's line to get faster 64 bit processing.
- OpenCL sounds cool and "open". Unfortunately it turns out that a lot of OpenCL operations are optional, so efficient OpenCL libraries would need to be tuned to the exact hardware series.
- OpenCL is not supported on semi-recent MacOS Intel or Apple Silicon series
- I seem to recall hearing that OpenCL is no longer supported by Nvidia either

I am a bit neurotic about getting things "just right" and I would really like the ability to resize panels on the desktop to predefined default configurations. I know that I can set up the panels by hand and save them, but I'd like to be able to automatically set a 3 column layout to 25%-50%-25% or perhaps 33%-34%-33% This would be somewhat like the snap feature in windows shown here: https://support.microsoft.com/en-us/windows/snap-your-windows-885a9b1e-a983-a3b1-16cd-c531795e6241. This wouldn't have to preclude setting them by hand but it would offer an automated alternative.
If this feature already exists, perhaps someone can point me to it.

Have been using Thingspeak for a few years, suddenly I get this message relating to one of my Matlab analysis scripts, which has run for years:
Error Message:
Unrecognized function or variable 'cusum'. cusum requires Signal Processing Toolbox.
What has changed to cause this error - I've done nothing!

Generate a 3D visualization of carnation flowers
with sepals and stems for celebrating Mother's Day 2026.

function carnation
% CARNATION Generate a 3D visualization of carnation flowers with sepals and stems.
% This code is authored by Zhaoxu Liu / slandarer
% for the purpose of celebrating Mother's Day 2026.
% =========================================================================
% Zhaoxu Liu / slandarer (2026). carnation for Mother's Day
% (https://www.mathworks.com/matlabcentral/fileexchange/183838-carnation-for-mother-s-day),
% MATLAB Central File Exchange. Retrieved May 9, 2026.
% Create figure and axes / 创建图窗及坐标区域
fig = figure('Units','normalized', 'Position',[.3,.1,.4,.8],'Color',[244,234,225]./255);
axes('Parent',fig, 'NextPlot','add', 'DataAspectRatio',[1,1,1],...
'View',[-64, 5.5], 'Position',[0,-.15,1,1], 'Color',[244,234,225]./255, ...
'XColor','none', 'YColor','none', 'ZColor','none');
annotation("textbox", [.05, .8, .9, .2], "String", {"Happy"; "Mother's Day"}, ...
'FontName','Segoe Script', 'FontSize',52, 'FontWeight','bold', 'EdgeColor','none', ...
'HorizontalAlignment','center', 'VerticalAlignment','middle', 'Color',[97,40,20]./255);
xx = linspace(0, 1, 100);
tt = linspace(0, 1, 1e4);
[X, P] = meshgrid(xx, tt);
T1 = P*20*pi;
C1 = 1 - (1 - mod(3.6*T1/pi, 2)).^4./2; % Petal profile / 花瓣形状
S1 = (sin(50*T1)/150 + sin(10*T1)/30).*min(1, max(0, (X - .85)/.1)); % Edge serration / 边缘褶皱和锯齿
Y1 = (- (X.*1.2 - .5).^5.*32 - 1)./15.*P; % Petal curvature / 花瓣弧度
% Petal shape and serration modeling + rotating the planar petal to tilt it
% 花瓣形状和锯齿塑造 + 转动平躺的花瓣令其倾斜
R1 = (C1 + S1).*(X.*sin(P) - Y1.*cos(P))./(P + .5);
H1 = (C1 + S1).*(X.*cos(P) + Y1.*sin(P));
% Convert radius to Cartesian coordinates / 将半径映射为X,Y坐标
X1 = R1.*cos(T1);
Y1 = R1.*sin(T1);
% Colormap for carnation petals / 康乃馨配色
CList1 = [208, 62, 23; 221,146,121; 229,201,202; 233,219,222; 237,223,225]./255;
CMat1 = zeros(1e4, 100, 3);
CMat1(:, :, 1) = repmat(interp1(linspace(0, 1, size(CList1, 1)), CList1(:, 1), linspace(0, 1, 100)), [1e4, 1]);
CMat1(:, :, 2) = repmat(interp1(linspace(0, 1, size(CList1, 1)), CList1(:, 2), linspace(0, 1, 100)), [1e4, 1]);
CMat1(:, :, 3) = repmat(interp1(linspace(0, 1, size(CList1, 1)), CList1(:, 3), linspace(0, 1, 100)), [1e4, 1]);
% Darken edges / 边缘的深色
for i = 1:1e4
tNum = randi([98, 100]);
CMat1(i, tNum:end, 1) = 212./255;
CMat1(i, tNum:end, 2) = 87./255;
CMat1(i, tNum:end, 3) = 113./255;
end
% Rotation matrices / 旋转矩阵
Rx = @(rx) [1, 0, 0; 0, cos(rx), -sin(rx); 0, sin(rx), cos(rx)];
Rz = @(yz) [cos(yz), - sin(yz), 0; sin(yz), cos(yz), 0; 0, 0, 1];
Rx1 = Rx(pi/6); Rz1 = Rz(0);
% Render flower / 绘制康乃馨
surface(X1, Y1, H1 + .3, 'CData',CMat1, 'EdgeAlpha',0.1, 'EdgeColor',[224,39,39]./255, 'FaceColor','interp')
[U1, V1, W1] = matRotate(X1, Y1, H1 + .3, Rx1);
surface(U1 + .7, V1 - .7, W1 - .6, 'CData',CMat1, 'EdgeAlpha',0.1, 'EdgeColor',[224,39,39]./255, 'FaceColor','interp')
% Following the same method as before,
% the profile is designed with four serrated cycles to simulate the four sepals.
% 还是之前的方法,不过让轮廓有4个锯齿状周期来模拟四片花萼
% Sepals generation with 4-lobed pattern / 生成四片花萼(带4个锯齿状周期)
[X, T] = meshgrid(linspace(0, 1, 100), linspace(0, 1, 100).*2*pi);
P2 = T.*0 + pi/8;
C2 = .5 + (.5 - abs(mod(T, pi/2)/pi*2 - .5))*.4;
Y2 = (- (X.*1 - .5).^7.*128 - 1)./15 - .1;
R2 = C2.*(X.*sin(P2) - Y2.*cos(P2));
H2 = C2.*(X.*cos(P2) + Y2.*sin(P2));
X2 = R2.*cos(T);
Y2 = R2.*sin(T);
% Rotate by 90 degrees around the z-axis
% and reduce the size to render the four smaller sepals.
% 绕z轴旋转90度且减小其大小,绘制四片小花萼
% Smaller sepal layer / 绘制四片小花萼(第二层)
P3 = T.*0 + pi/10;
C3 = .3 + (.5 - abs(mod(T + pi/4, pi/2)/pi*2 - .5))*.7;
Y3 = (- (X.*.7 - .5).^7.*128 - 1)./15 - .1;
R3 = C3.*(X.*sin(P3) - Y3.*cos(P3));
H3 = C3.*(X.*cos(P3) + Y3.*sin(P3));
X3 = R3.*cos(T);
Y3 = R3.*sin(T);
% Colormap for sepals / 花托配色
CList2 = [178,173,113; 151,135, 73; 117,123, 50; 86, 89, 29; 75, 65, 17]./255;
CMat2 = zeros(100, 100, 3);
CMat2(:, :, 1) = repmat(interp1(linspace(0, 1, size(CList2, 1)), CList2(:, 1), linspace(0, 1, 100)), [100, 1]);
CMat2(:, :, 2) = repmat(interp1(linspace(0, 1, size(CList2, 1)), CList2(:, 2), linspace(0, 1, 100)), [100, 1]);
CMat2(:, :, 3) = repmat(interp1(linspace(0, 1, size(CList2, 1)), CList2(:, 3), linspace(0, 1, 100)), [100, 1]);
% Render sepals / 绘制花托
surf(X2, Y2, H2.*.8 + .12, 'CData',CMat2, 'EdgeAlpha',0.1, 'EdgeColor',CList2(end,:), 'FaceColor','interp')
surf(X3.*.93, Y3.*.92, H3.*.5 + .02, 'FaceColor',[ 84, 85, 54]./255, 'EdgeAlpha',0.1, 'EdgeColor','k')
[U2, V2, W2] = matRotate(X2, Y2, H2.*.8 + .12, Rx1);
[U3, V3, W3] = matRotate(X3.*.93, Y3.*.92, H3.*.5 + .02, Rx1);
surf(U2 + .7, V2 - .7, W2 - .6, 'CData',CMat2, 'EdgeAlpha',0.1, 'EdgeColor',CList2(end,:), 'FaceColor','interp')
surf(U3 + .7, V3 - .7, W3 - .6, 'FaceColor',[ 84, 85, 54]./255, 'EdgeAlpha',0.1, 'EdgeColor','k')
% A pulse function with two periods is applied
% to the contour to simulate the leaves.
% 让轮廓有2个周期且是脉冲函数,来模拟叶片
P4 = T.*0 + pi/16;
C4 = - abs(mod(T, pi)/pi - .5) + .11;
C4(C4 < 0) = 0; C4 = C4.*10; C4(51:100, :) = C4(51:100, :).*.7;
Y4 = (- (X.*1.01 - .5).^7.*128 - 1)./15 - .03;
R4 = C4.*(X.*sin(P4) - Y4.*cos(P4));
H4 = C4.*(X.*cos(P4) + Y4.*sin(P4));
X4 = R4.*cos(T);
Y4 = R4.*sin(T);
surf(X4 - .1, Y4 + .05, H4 - 2.2, 'FaceColor',[ 84, 85, 54]./255, 'EdgeAlpha',0.1, 'EdgeColor','k')
[U4, V4, W4] = matRotate(X4 - .1, Y4 - .1, H4 + .1, Rz1);
[U4, V4, W4] = matRotate(U4, V4, W4, Rx1);
surf(U4 + .7, V4 - .7 + 1, W4 - .6 - 1.2, 'FaceColor',[ 84, 85, 54]./255, 'EdgeAlpha',0.1, 'EdgeColor','k')
P5 = T.*0 + pi/8;
C5 = - abs(mod(T + pi/6, pi)/pi - .5) + .11;
C5(C5 < 0) = 0; C5 = C5.*5;
Y5 = (- (X.*1.01 - .5).^7.*128 - 1)./15 - .1;
R5 = C5.*(X.*sin(P5) - Y5.*cos(P5));
H5 = C5.*(X.*cos(P5) + Y5.*sin(P5));
X5 = R5.*cos(T);
Y5 = R5.*sin(T);
surf(X5, Y5, H5 - .3, 'FaceColor',[ 84, 85, 54]./255, 'EdgeAlpha',0.1, 'EdgeColor','k')
[U5, V5, W5] = matRotate(X5, Y5, H5+.1, Rx1);
surf(U5 + .7, V5 - .7 + 1/4, W5 - .6 - 1.7/4, 'FaceColor',[ 84, 85, 54]./255, 'EdgeAlpha',0.1, 'EdgeColor','k')
% Render stems / 绘制花杆
P1_1 = [mean(X3(:).*.93), mean(Y3(:).*.92), mean(H3(:).*.5 + .02)];
P1_2 = [mean(X5(:)), mean(Y5(:)), mean(H5(:) - .3)];
P1_3 = [mean(X4(:) - .1), mean(Y4(:) + .05), mean(H4(:) - 2.2)];
P1_3 = (P1_3 - P1_2).*1.4 + P1_2;
[XX1, YY1, ZZ1] = cylinderXYZ(P1_1, P1_2, .05);
[XX2, YY2, ZZ2] = cylinderXYZ(P1_2, P1_3, .04);
surf(XX1, YY1, ZZ1, 'FaceColor',[ 84, 85, 54]./255, 'EdgeAlpha',0.1, 'EdgeColor','k')
surf(XX2, YY2, ZZ2, 'FaceColor',[ 84, 85, 54]./255, 'EdgeAlpha',0.1, 'EdgeColor','k')
P1_1 = [mean(U3(:) + .7), mean(V3(:) - .7), mean(W3(:) - .6)];
P1_2 = [mean(U5(:) + .7), mean(V5(:) - .7 + 1/4), mean(W5(:) - .6 - 1.7/4)];
P1_3 = [mean(U4(:) + .7), mean(V4(:) - .7 + 1), mean(W4(:) - .6 - 1.2)];
P1_3 = (P1_3 - P1_2).*2.4 + P1_2;
[XX1, YY1, ZZ1] = cylinderXYZ(P1_1, P1_2, .05);
[XX2, YY2, ZZ2] = cylinderXYZ(P1_2, P1_3, .04);
surf(XX1, YY1, ZZ1, 'FaceColor',[ 84, 85, 54]./255, 'EdgeAlpha',0.1, 'EdgeColor','k')
surf(XX2, YY2, ZZ2, 'FaceColor',[ 84, 85, 54]./255, 'EdgeAlpha',0.1, 'EdgeColor','k')
% 在任意两点间构建圆柱
function [XX, YY, ZZ] = cylinderXYZ(P1, P2, r)
% CYLINDERXYZ Create a cylinder connecting two 3D points
% [XX, YY, ZZ] = cylinderXYZ(P1, P2, r) generates a cylinder
% of radius r between points P1 and P2.
v = P2 - P1; l = norm(v);
if l < eps, return; end
[XX, YY, ZZ] = cylinder(r, 30); ZZ = ZZ * l;
ddir = [0, 0, 1]; tdir = v / l;
if dot(ddir, tdir) > 0.9999
R = eye(3);
elseif dot(ddir, tdir) < -0.9999
R = [1, 0, 0; 0, -1, 0; 0, 0, -1];
else
av = cross(ddir, tdir); av = av / norm(av);
R = axisRotate(av, acos(dot(ddir, tdir)));
end
for ii = 1:size(XX, 1)
for jj = 1:size(XX, 2)
p = R * [XX(ii, jj); YY(ii, jj); ZZ(ii, jj)];
XX(ii, jj) = p(1) + P1(1);
YY(ii, jj) = p(2) + P1(2);
ZZ(ii, jj) = p(3) + P1(3);
end
end
end
% 通过矩阵旋转数据
function [U, V, W] = matRotate(X, Y, Z, R)
% MATROTATE Apply 3x3 rotation matrix to a set of 3D points
% [U,V,W] = matRotate(X,Y,Z,R) rotates points (X,Y,Z)
% using rotation matrix R.
U = X; V = Y; W = Z;
for ii = 1:numel(X)
v = [X(ii); Y(ii); Z(ii)];
n = R*v; U(ii) = n(1); V(ii) = n(2); W(ii) = n(3);
end
end
% 根据轴-角参数生成旋转矩阵
function R = axisRotate(axis, angle)
% AXISROTATE Compute rotation matrix from axis-angle representation
% R = axisRotate(axis, angle) returns a 3x3 rotation matrix
% for rotating by angle (radians) around the given axis vector.
% Implementation based on Rodrigues' rotation formula.
u = axis(1); v = axis(2); w = axis(3);
c = cos(angle); s = sin(angle);
R = [u^2 + (1-u^2)*c, u*v*(1-c) - w*s, u*w*(1-c) + v*s;
u*v*(1-c) + w*s, v^2 + (1-v^2)*c, v*w*(1-c) - u*s;
u*w*(1-c) - v*s, v*w*(1-c) + u*s, w^2 + (1-w^2)*c];
end
end

Hi,
I am trying to use an esp32 board with quectal ec200u LTE Modem to send sensor data to thingspeak. The board can process the sensor data however I am unable to send the data to thingspeak. I have used the same process earlier too however with a different modem from Simcom.
Can someone help me with specific commands for achieving this? I can share the code which i am trying to use.
Regards
Aditya

Good morning everyone. I’m having a problem with ThingSpeak. I’m sending data from an ESP LoRa with the RTC set to the Brasília time zone (GMT-3).
Previously, when I exported the data to CSV, it used the ThingSpeak time, which appeared 3 hours ahead. Now that I’m sending the timestamp from the ESP, the graphs are showing the data 3 hours behind. Is there a way to align the graph times while keeping the Brazilian time zone?

I have been a loyal MATLAB user for 25 years, starting from my university days. While many of my peers migrated to Python, I stayed for the stability, compatibility, and clean environment. However, I am finding the 2025 version exceptionally laggy. Despite running it on an $10k high-end machine, simple tasks like viewing variables and plotting take up to 60 seconds - actions that were near instantaneous in the 2020 version. I want to stay continue with MATLAB, but this performance gap is a major hurdle and irritation. I hope these optimization issues can be addressed quickly.
PLEASE, PLEASE, PLEASE... make MATLAB Copilot available as an option with a home license.
Please change the documentation window (https://www.mathworks.com/help/index.html) so I don't have to first click a magnifying glass before I can to get to a text field to enter my search term.

