가우스 혼합 모델의 데이터 시뮬레이션
이 예제에서는 완전히 지정된 gmdistribution 객체와 random 함수를 사용하여 가우스 혼합 모델(GMM)에서 데이터를 시뮬레이션하는 방법을 보여줍니다.
알려진 두 개의 성분을 갖는 GMM 객체를 생성합니다.
mu = [1 2;-3 -5];
sigma = cat(3,[2 0;0 .5],[1 0;0 1]);
p = ones(1,2)/2;
gm = gmdistribution(mu,sigma,p);
GMM의 pdf 등고선을 플로팅합니다.
gmPDF = @(x,y) arrayfun(@(x0,y0) pdf(gm,[x0 y0]),x,y);
fcontour(gmPDF,[-10 10]);
title('Contour lines of pdf');
GMM에서 1,000개의 확률 변량을 생성합니다.
rng('default') % For reproducibility
X = random(gm,1000);
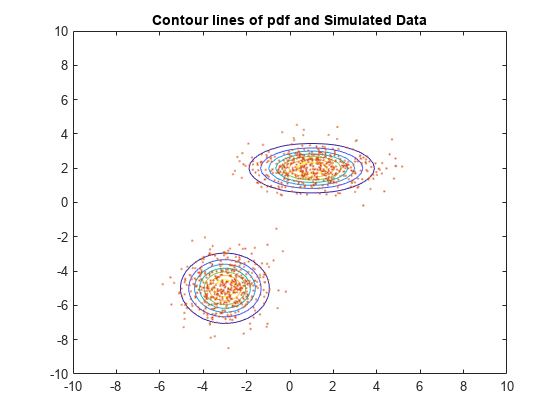
pdf 등고선과 함께 확률 변량을 플로팅합니다.
hold on
scatter(X(:,1),X(:,2),10,'.') % Scatter plot with points of size 10
title('Contour lines of pdf and Simulated Data')
참고 항목
fitgmdist | gmdistribution | mvnrnd | random