SupervisedLearningBayesianOptimization
Description
SupervisedLearningBayesianOptimization is an object that contains
the results of a Bayesian optimization applied to a supervised learning model. The object
contains data for each iteration of the optimization that can be accessed by a plot function
or an output function.
Creation
Create a SupervisedLearningBayesianOptimization object by using one of
the following fit functions with the OptimizeHyperparameters name-value
argument.
Classification fit functions:
fitcdiscr,fitcecoc,fitcensemble,fitcgam,fitckernel,fitcknn,fitclinear,fitcnb,fitcnet,fitcsvm, orfitctreeRegression fit functions:
fitrensemble,fitrgam,fitrgp,fitrkernel,fitrlinear,fitrnet,fitrsvm, orfitrtreeQuantile regression fit functions:
fitrqlinearorfitrqnet
You can also create a SupervisedLearningBayesianOptimization object by
using the fitcauto and
fitrauto functions.
For more information, see Ways to Perform Bayesian Optimization.
Properties
Problem Definition Properties
This property is read-only.
Objective function, returned as a function handle. When you call a fit function
containing the OptimizeHyperparameters name-value argument,
ObjectiveFcn is a function handle that returns the validation
loss specified in LossFun.
Data Types: function_handle
This property is read-only.
Loss function, returned as one of the values in the following table.
| Value | Description |
|---|---|
'classifcost' | Observed misclassification cost |
'classiferror' | Misclassified rate in decimal |
'mincost' | Minimal expected misclassification cost (for classification scores that are posterior probabilities) |
'mse' | Mean squared error |
'quantile' | Quantile loss, averaged across the quantiles |
Data Types: char
This property is read-only.
Hyperparameters to optimize, returned as a vector of optimizableVariable objects.
This property is read-only.
Options used during Bayesian optimization, returned as a structure. When you call
a fit function with the OptimizeHyperparameters name-value
argument, the options are the default bayesopt options, modified by the
HyperparameterOptimizationOptions name-value argument.
The Options structure contains the following fields.
| Field | Description |
|---|---|
AcquisitionFunctionName | Acquisition function name (with dashes removed). See Acquisition Function Types. |
IsObjectiveDeterministic | true means the objective function is deterministic;
false means it is not. |
ExplorationRatio | Used only when AcquisitionFunctionName is
'expectedimprovementplus' or
'expectedimprovement-persecondplus'. See Plus. |
MaxObjectiveEvaluations | Objective function evaluation limit |
MaxTime | Time limit |
XConstraintFcn | Deterministic constraints on variables. See Deterministic Constraints — XConstraintFcn. |
ConditionalVariableFcn | Conditional variable constraints. See Conditional Constraints — ConditionalVariableFcn. |
NumCoupledConstraints | Number of coupled constraints. See Coupled Constraints. |
CoupledConstraintTolerances | Coupled constraint tolerances. See Coupled Constraints. |
AreCoupledConstraintsDeterministic | Logical vector specifying whether each coupled constraint is deterministic |
Verbose | Command-line display level |
OutputFcn | Function called after each iteration. See Bayesian Optimization Output Functions. |
SaveVariableName | Variable name for the @assignInBase output
function |
SaveFileName | Filename for the @saveToFile output function |
PlotFcn | Plot function called after each iteration. See Bayesian Optimization Plot Functions |
InitialX | Points where bayesopt evaluated the objective
function |
InitialObjective | Objective function values at InitialX |
InitialConstraintViolations | Coupled constraint function values at InitialX |
InitialErrorValues | Error values at InitialX |
InitialObjectiveEvaluationTimes | Objective function evaluation times at
InitialX |
InitialIterationTimes | Time for each iteration, including the objective function evaluation and other computations |
Data Types: struct
Solution Properties
This property is read-only.
Minimum observed value of the objective function, returned as a real scalar. When the optimization includes coupled constraints or evaluation errors, this value is the minimum over all observed points that are feasible according to the final constraint and error models.
Data Types: double
This property is read-only.
Observed point with the minimum objective function value, returned as a
1-by-D table, where D is
the number of variables.
Data Types: table
This property is read-only.
Estimated objective function value at XAtMinEstimatedObjective, returned
as a real scalar.
MinEstimatedObjective is the mean value of the posterior distribution of the final objective model. The software estimates the MinEstimatedObjective value by passing XAtMinEstimatedObjective to the object function predictObjective.
Data Types: double
This property is read-only.
Point with the minimum upper confidence bound of the objective function value among the
visited points, returned as a 1-by-D table, where
D is the number of variables. The software uses the final
objective model to find the upper confidence bounds of the visited points.
XAtMinEstimatedObjective is the same as the best point returned by the bestPoint function with the default criterion ('min-visited-upper-confidence-interval').
Data Types: table
This property is read-only.
Number of objective function evaluations, returned as a positive integer. This number includes the initial evaluations used to form a posterior model, as well as evaluations during the optimization iterations.
Data Types: double
This property is read-only.
Total elapsed time of the optimization in seconds, returned as a positive scalar.
Data Types: double
This property is read-only.
Next point to evaluate if the optimization continues, returned as a
1-by-D table, where D is
the number of variables.
Data Types: table
Trace Properties
This property is read-only.
Points at which the objective function is evaluated, returned as a
T-by-D table, where T is
the number of evaluation points and D is the number of
variables.
Data Types: table
This property is read-only.
Objective function values, returned as a column vector of length T, where
T is the number of evaluation points.
ObjectiveTrace contains the history of the objective function
evaluations.
Data Types: double
This property is read-only.
Loss values, returned as a column vector of length T or a
T-by-Q matrix, where T is
the number of evaluation points and Q is the number of quantiles.
If you optimize a classification model,
LossTraceis the same asObjectiveTrace.If you optimize a nonquantile regression model,
log(1+LossTrace)is the same asObjectiveTrace.If you optimize a quantile regression model,
log(1+mean(LossTrace,2))is the same asObjectiveTrace.
Data Types: double
This property is read-only.
Objective function evaluation times, returned as a column vector of length
T, where T is the number of evaluation points.
ObjectiveEvaluationTimeTrace includes the time required to
evaluate coupled constraints, because the objective function computes these
constraints.
Data Types: double
This property is read-only.
Iteration times, returned as a column vector of length T, where
T is the number of evaluation points.
IterationTimeTrace includes the objective function evaluation
time and other overhead.
Data Types: double
This property is read-only.
Coupled constraint values, returned as a T-by-K array,
where T is the number of evaluation points and K
is the number of coupled constraints.
Data Types: double
This property is read-only.
Error indications, returned as a column vector of length T containing
-1 or 1 entries, where T is
the number of evaluation points. Each 1 entry indicates that the
objective function issues an error or returns NaN on the
corresponding point in XTrace. Each -1 entry
indicates that the software computes the objective function value.
Data Types: double
This property is read-only.
Feasibility indications, returned as a logical column vector of length T,
where T is the number of evaluation points. Each 1
entry indicates that the final constraint model predicts feasibility at the
corresponding point in XTrace.
Data Types: logical
This property is read-only.
Probability that an evaluation point is feasible, returned as a column vector of length
T, where T is the number of evaluation points.
The probabilities come from the final constraint model, including the error constraint
model, on the corresponding points in XTrace.
Data Types: double
This property is read-only.
Evaluation that gives the minimum feasible objective, returned as a
column vector of integer indices of length T,
where T is the number of evaluation points.
Feasibility is determined with respect to the constraint models
at each iteration, including the error constraint model.
Data Types: double
This property is read-only.
Minimum observed objective, returned as a column vector of length T, where
T is the number of evaluation points.
Data Types: double
This property is read-only.
Estimated objective, returned as a column vector of length T, where
T is the number of evaluation points. The estimated objective at
each iteration is determined with respect to the objective model at that iteration. At
each iteration, the software uses the object function predictObjective to estimate the objective function value at the point
with the minimum upper confidence bound of the objective function among the visited
points.
Data Types: double
This property is read-only.
Auxiliary data from the objective function, returned as a cell array of length
T, where T is the number of evaluation points.
Each entry in the cell array is the UserData value returned in the
third output of the objective function.
Data Types: cell
Object Functions
bestPoint | Best point in a Bayesian optimization according to a criterion |
plot | Plot Bayesian optimization results |
predictConstraints | Predict coupled constraint violations at a set of points |
predictError | Predict error value at a set of points |
predictObjective | Predict objective function at a set of points |
predictObjectiveEvaluationTime | Predict objective function run times at a set of points |
resume | Resume a Bayesian optimization |
Examples
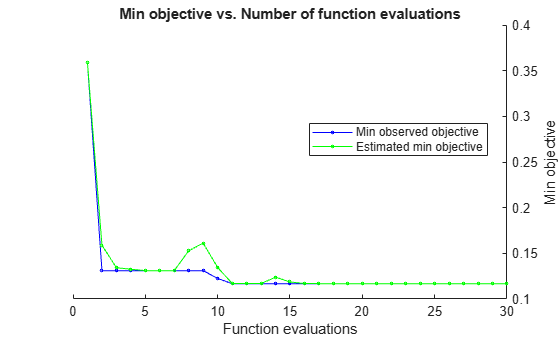
Minimize the cross-validation loss in the ionosphere data set using Bayesian optimization of an SVM (support vector machine) classifier.
Load the data set.
load ionosphereOptimize the classification using the "auto" parameters.
rng("default") % For reproducibility Mdl = fitcsvm(X,Y,OptimizeHyperparameters="auto")
|====================================================================================================================|
| Iter | Eval | Objective | Objective | BestSoFar | BestSoFar | BoxConstraint| KernelScale | Standardize |
| | result | | runtime | (observed) | (estim.) | | | |
|====================================================================================================================|
| 1 | Best | 0.35897 | 0.86394 | 0.35897 | 0.35897 | 3.8653 | 961.53 | true |
| 2 | Best | 0.12821 | 7.4989 | 0.12821 | 0.15646 | 429.99 | 0.2378 | false |
| 3 | Accept | 0.35897 | 0.055718 | 0.12821 | 0.1315 | 0.11801 | 8.9479 | false |
| 4 | Accept | 0.1339 | 3.5854 | 0.12821 | 0.12965 | 0.0010694 | 0.0032063 | true |
| 5 | Accept | 0.15954 | 8.1725 | 0.12821 | 0.12824 | 973.65 | 0.15179 | false |
| 6 | Accept | 0.19373 | 8.3042 | 0.12821 | 0.12824 | 0.082075 | 0.0010015 | false |
| 7 | Accept | 0.35897 | 0.080375 | 0.12821 | 0.12825 | 0.001081 | 10.29 | false |
| 8 | Accept | 0.35897 | 0.02294 | 0.12821 | 0.12826 | 0.0010185 | 0.86594 | false |
| 9 | Accept | 0.13105 | 0.033065 | 0.12821 | 0.12826 | 48.333 | 22.975 | false |
| 10 | Best | 0.12251 | 0.023233 | 0.12251 | 0.12251 | 318.22 | 30.945 | false |
| 11 | Accept | 0.12536 | 0.04698 | 0.12251 | 0.12151 | 134.97 | 6.9645 | false |
| 12 | Accept | 0.12251 | 0.034366 | 0.12251 | 0.12171 | 995.75 | 54.283 | false |
| 13 | Accept | 0.1396 | 0.036487 | 0.12251 | 0.12153 | 269.27 | 68.851 | false |
| 14 | Accept | 0.12821 | 0.059505 | 0.12251 | 0.1221 | 992 | 14.219 | false |
| 15 | Accept | 0.12536 | 0.074519 | 0.12251 | 0.12204 | 34.733 | 3.1824 | false |
| 16 | Accept | 0.35897 | 0.034307 | 0.12251 | 0.12242 | 994.54 | 928.28 | false |
| 17 | Accept | 0.13105 | 0.32086 | 0.12251 | 0.12241 | 163.72 | 1.8364 | false |
| 18 | Accept | 0.14245 | 0.14315 | 0.12251 | 0.12241 | 12.515 | 0.71093 | false |
| 19 | Accept | 0.13105 | 2.8591 | 0.12251 | 0.12241 | 2.8323 | 0.08191 | false |
| 20 | Accept | 0.1339 | 0.023919 | 0.12251 | 0.12242 | 0.0010157 | 0.43646 | true |
|====================================================================================================================|
| Iter | Eval | Objective | Objective | BestSoFar | BestSoFar | BoxConstraint| KernelScale | Standardize |
| | result | | runtime | (observed) | (estim.) | | | |
|====================================================================================================================|
| 21 | Accept | 0.12251 | 0.030648 | 0.12251 | 0.12241 | 0.029099 | 0.42599 | true |
| 22 | Best | 0.11681 | 0.032407 | 0.11681 | 0.11681 | 0.0071371 | 0.14886 | true |
| 23 | Accept | 0.13105 | 0.36479 | 0.11681 | 0.11681 | 0.33566 | 0.14957 | true |
| 24 | Accept | 0.35897 | 0.02391 | 0.11681 | 0.11679 | 0.0042685 | 2.6596 | true |
| 25 | Best | 0.11396 | 0.022929 | 0.11396 | 0.1139 | 0.0070082 | 0.27363 | true |
| 26 | Accept | 0.13105 | 0.022174 | 0.11396 | 0.11389 | 0.0010031 | 0.18421 | true |
| 27 | Accept | 0.12251 | 0.089814 | 0.11396 | 0.11427 | 0.026095 | 0.22924 | true |
| 28 | Accept | 0.12251 | 0.084291 | 0.11396 | 0.11422 | 0.0022541 | 0.052192 | true |
| 29 | Accept | 0.12821 | 0.12032 | 0.11396 | 0.11435 | 0.015116 | 0.054994 | true |
| 30 | Accept | 0.11966 | 0.025958 | 0.11396 | 0.11625 | 0.0050646 | 0.30732 | true |
__________________________________________________________
Optimization completed.
MaxObjectiveEvaluations of 30 reached.
Total function evaluations: 30
Total elapsed time: 42.2612 seconds
Total objective function evaluation time: 33.0906
Best observed feasible point:
BoxConstraint KernelScale Standardize
_____________ ___________ ___________
0.0070082 0.27363 true
Observed objective function value = 0.11396
Estimated objective function value = 0.11625
Function evaluation time = 0.022929
Best estimated feasible point (according to models):
BoxConstraint KernelScale Standardize
_____________ ___________ ___________
0.0070082 0.27363 true
Estimated objective function value = 0.11625
Estimated function evaluation time = 0.027922

Mdl =
ClassificationSVM
ResponseName: 'Y'
CategoricalPredictors: []
ClassNames: {'b' 'g'}
ScoreTransform: 'none'
NumObservations: 351
HyperparameterOptimizationResults: [1×1 classreg.learning.paramoptim.SupervisedLearningBayesianOptimization]
Alpha: [115×1 double]
Bias: 0.2433
KernelParameters: [1×1 struct]
Mu: [0.8917 0 0.6413 0.0444 0.6011 0.1159 0.5501 0.1194 0.5118 0.1813 0.4762 0.1550 0.4008 0.0934 0.3442 0.0711 0.3819 -0.0036 0.3594 -0.0240 0.3367 0.0083 0.3625 -0.0574 0.3961 -0.0712 0.5416 -0.0695 … ] (1×34 double)
Sigma: [0.3112 0 0.4977 0.4414 0.5199 0.4608 0.4927 0.5207 0.5071 0.4839 0.5635 0.4948 0.6222 0.4949 0.6528 0.4584 0.6180 0.4968 0.6263 0.5191 0.6098 0.5182 0.6038 0.5275 0.5785 0.5085 0.5162 0.5500 0.5759 … ] (1×34 double)
BoxConstraints: [351×1 double]
ConvergenceInfo: [1×1 struct]
IsSupportVector: [351×1 logical]
Solver: 'SMO'
Properties, Methods
The fit achieved about 12% loss for the default 5-fold cross-validation.
Examine the SupervisedLearningBayesianOptimization object returned in the HyperparameterOptimizationResults property of the trained model Mdl.
disp(Mdl.HyperparameterOptimizationResults)
SupervisedLearningBayesianOptimization
ObjectiveFcn: @createObjFcn/inMemoryObjFcn
VariableDescriptions: [5×1 optimizableVariable]
Options: [1×1 struct]
MinObjective: 0.1140
XAtMinObjective: [1×3 table]
MinEstimatedObjective: 0.1162
XAtMinEstimatedObjective: [1×3 table]
NumObjectiveEvaluations: 30
TotalElapsedTime: 42.2612
NextPoint: [1×3 table]
XTrace: [30×3 table]
ObjectiveTrace: [30×1 double]
LossFun: 'classiferror'
LossTrace: [30×1 double]
ConstraintsTrace: []
UserDataTrace: {30×1 cell}
ObjectiveEvaluationTimeTrace: [30×1 double]
IterationTimeTrace: [30×1 double]
ErrorTrace: [30×1 double]
FeasibilityTrace: [30×1 logical]
FeasibilityProbabilityTrace: [30×1 double]
IndexOfMinimumTrace: [30×1 double]
ObjectiveMinimumTrace: [30×1 double]
EstimatedObjectiveMinimumTrace: [30×1 double]
Version History
Introduced in R2026a
MATLAB Command
You clicked a link that corresponds to this MATLAB command:
Run the command by entering it in the MATLAB Command Window. Web browsers do not support MATLAB commands.
웹사이트 선택
번역된 콘텐츠를 보고 지역별 이벤트와 혜택을 살펴보려면 웹사이트를 선택하십시오. 현재 계신 지역에 따라 다음 웹사이트를 권장합니다:
또한 다음 목록에서 웹사이트를 선택하실 수도 있습니다.
사이트 성능 최적화 방법
최고의 사이트 성능을 위해 중국 사이트(중국어 또는 영어)를 선택하십시오. 현재 계신 지역에서는 다른 국가의 MathWorks 사이트 방문이 최적화되지 않았습니다.
미주
- América Latina (Español)
- Canada (English)
- United States (English)
유럽
- Belgium (English)
- Denmark (English)
- Deutschland (Deutsch)
- España (Español)
- Finland (English)
- France (Français)
- Ireland (English)
- Italia (Italiano)
- Luxembourg (English)
- Netherlands (English)
- Norway (English)
- Österreich (Deutsch)
- Portugal (English)
- Sweden (English)
- Switzerland
- United Kingdom (English)