Use Sinestream Signal Generator Block for Offline Frequency Response Estimation
This example shows how to use the Sinestream Signal Generator block to create a sinestream input signal for offline frequency response estimation experiment. In practice, you can use this approach to perform the experiment in real time against a physical plant. In this example, you perform the experiment on a plant modeled in Simulink®.
Model and Signal Logging
This example uses a model containing a preconfigured Sinestream Signal Generator block to inject perturbation signal for offline frequency response estimation.
Open the model.
mdl = "SineSigGenForOfflineFREDataLogging.slx";
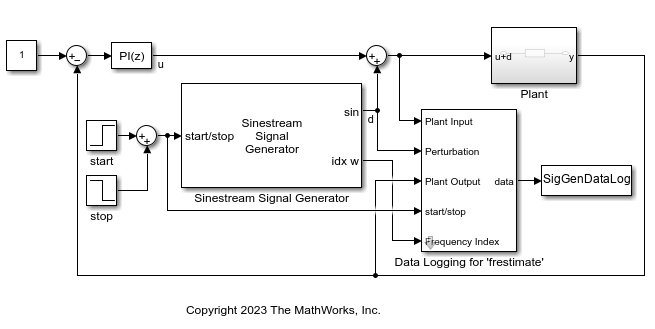
open_system(mdl)The model contains a plant in a closed-loop configuration with a PI controller. The Sinestream Signal Generator block feeds a perturbation signal in addition to the control signal into the plant input and the Data Logging for 'frestimate' subsystem collects the response data.
Signal Parameter Settings
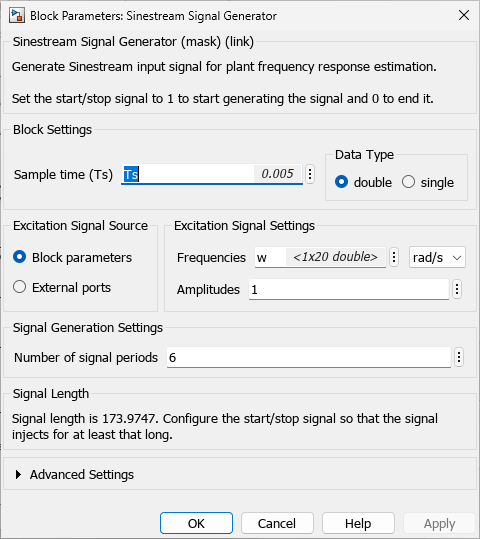
The block is configured to generate a sinestream signal at 20 logarithmically-spaced frequencies between 1 rad/s and 100 rad/s, all with amplitudes of 1. In addition, there are 6 periods of signal for each frequency point. After you configure the block and click the Apply button, the block parameters display Signal Length information based on the parameter settings. You must configure the start/stop port such that the signal injects for at least that long for comprehensive experiments.
The block also provides advanced settings, such as option to generate sine, cosine, or both waveforms in the Waveform Type section. You can also configure a consistent Phase Shift in the generated signals, in either degrees or radians.
To generate balanced three-phase sinestream signals, you can use the Generate three-phase perturbation signal option. The generated signal is balanced because the summation of these three-phase signals always equals zero. These signals are useful in the analysis of three-phase alternating current (AC) electric circuits.
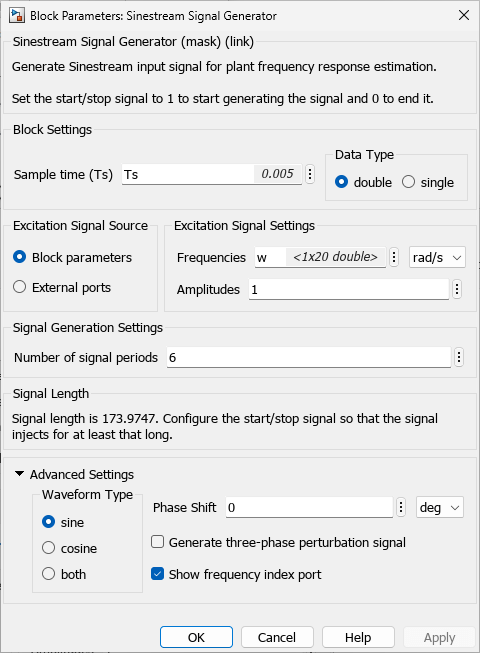
In this example, the block uses the Show frequency index port option to enable an additional output port idx w. During simulation, the signal at this port shows the corresponding index of the generated frequency component. A staircase signal is helpful for post processing the logged experiment data. This signal is specifically used to generate a Ready signal similar to the logged signal when using the Frequency Response Estimator block.
Collect Experiment Data
The Data Logging for 'frestimate' subsystem collects experiment data in a data object SigGenDataLog. Besides the Ready signal, the subsystem also logs the Perturbation, PlantInput, and PlantOutput signals in the data object. Inside the Data Logging for 'frestimate' subsystem, the Subtract Nominal Values subsystem removes the nominal values from the logged input and output signals.

Simulate the model.
sim(mdl)
The signal generator block injects the generated sinestream perturbation signal in the closed loop. Since the PI controller is still in the loop, you can conduct frequency response estimation experiment at the desired operating points.
Show the logged data with compatible format for offline frequency response estimation.
SigGenDataLog
SigGenDataLog = struct with fields:
           Ready: [1×1 timeseries]
    Perturbation: [1×1 timeseries]
      PlantInput: [1×1 timeseries]
     PlantOutput: [1×1 timeseries]
            Info: [1×1 struct]
The Ready field is a timeseries containing a logical signal that indicates which time steps contain the data used for the estimation. For a sinestream signal, this field indicates which perturbation periods for the estimation to discard (settling periods). Perturbation contains the sinestream perturbation applied to the plant. The PlantInput and PlantOutput timeseries contain the plant's input and output signals.
Estimate Frequency Response
You can use the data to perform frequency response estimation offline, using the frestimate command.
Use the SigGenDataLog structure and specified frequencies as inputs to the frestimate command. frestimate processes SigGenDataLog to obtain a frequency response data (frd) model containing the estimated responses at specified frequencies.
sys_estim = frestimate(SigGenDataLog,w,'rad/s');
size(sys_estim)
FRD model with 1 outputs, 1 inputs, and 20 frequency points.
Examine Estimated Frequency Response
You can compare the frequency response estimation result with the result obtained in the example Collect Frequency Response Experiment Data for Offline Estimation.
load("FREResultComparisonForSinestream.mat");
linsys = c2d(tf(10,[1 10 1000]),0.005);
opts = bodeoptions;
opts.XLim = [1 100];
opts.YLim = {[-60 -25];[-200 0]};
figure
bode(linsys,"k-",sys_estim,"b*",sys_freblk,"ro",opts);
legend("Linear Plant Model","Using Sinestream Signal Generator",...
    "Using Frequency Response Estimator","Location","southwest");

The Bode plot shows identical frequency response estimation results. Therefore, you can use the Sinestream Signal Generator block to conduct offline frequency response estimation as an alternative to the Frequency Response Estimator block. Compared to the Frequency Response Estimator block, the Sinestream Signal Generator block is more flexible and provides better customization for sinestream signal parameters. More importantly, you can use the signal generator blocks to reduce the hardware requirement in a deployed environment with limited computational resources.
See Also
frestimate | Sinestream Signal
Generator | PRBS Signal
Generator