Measure Boost Converter Output Impedance Using Signal Generator Blocks
This example shows how to use the Sinestream Signal Generator and PRBS Signal Generator blocks to create input signals to measure the output impedance of a boost converter through an offline frequency response estimation experiment. In practice, you can use this approach to perform the experiment in real time against a physical plant. In this example, the boost converter is modeled in Simulink® using Simscape™ Electrical™ components.
Boost Converter Model
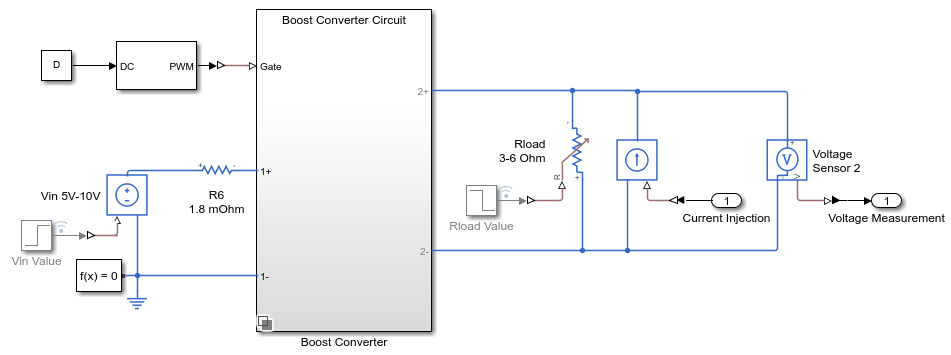
This example uses a plant model based on the boost converter model. The boost converter model is in an open-loop configuration with a nominal output voltage of 18V. To estimate the frequency response model for output impedance, the model contains a Controlled Current Source block parallel with the load for injecting a perturbation signal and a Voltage Sensor block to measure output voltage.
Furthermore, you can switch between different implementations of the same boost converter in the subsystem Boost Converter. Whichever implementation you use, the model includes full switching details of power electronics components from a PWM generator block. The period of the generated PWM signal is 5e-5 seconds.
Analytical Impedance Model
Based on the boost converter circuit model, you can express an analytical output impedance as a continuous transfer function. You can discretize the transfer function and use it as a reference for the offline frequency response estimation result.
L = 20e-6;
C = 1480e-6;
R = 6;
rC = 8e-3;
rL = 1.8e-3;
D = 0.734785;
d = 1-D;
Zout = tf(R*[C*rC*L L+C*rC*(rL+R*D*rC*d/(R+rC)) rL+R*D*rC*d/(R+rC)], ...
[L*C*(R+rC) L+C*rL*(R+rC)+C*R*rC-R*D*C*rC R+rL-R*D-R^2*D*d/(R+rC)]);
Use Sinestream Signal Generator Block
This section uses a model with a Sinestream Signal Generator block preconfigured to inject perturbation signal for offline frequency response estimation.
Open the model.
mdl = "scdboostconverterZSinestreamSigGen.slx";
open_system(mdl)
Signal Parameter Settings
The block is configured to generate a sinestream signal over 20 frequencies between 200 rad/s and 60000 rad/s, all with amplitudes of 0.5. There are 6 periods of signal for each frequency point. After you configure the block and click the Apply button, the block parameters display Signal Length information based on the parameter settings. You must configure the start/stop port such that the signal injects for at least that long for comprehensive experiments.
The block also provides advanced settings, such as option to generate sine, cosine, or both waveforms in the Waveform Type section. You can also configure a consistent Phase Shift in the generated signals, in either degrees or radians.
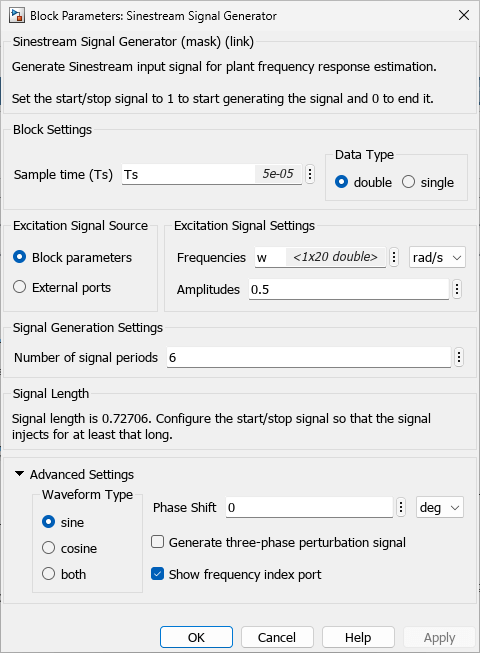
In this example, the block uses the Show frequency index port option to enable an additional output port idx w. During simulation, the signal at this port shows the corresponding index of the generated frequency component. This staircase signal is helpful for post processing the logged experiment data. This signal is specifically used to generate a Ready signal similar to the logged signal when using the Frequency Response Estimator block.
Collect Experiment Data
The Data Logging for 'frestimate' subsystem collects experiment data in a data object SigGenDataLog. Besides the Ready signal, the subsystem also logs the Perturbation, PlantInput, and PlantOutput signals in the data object.

Simulate the model.
sim(mdl)
The signal generator block injects the generated sinestream perturbation signal through the current source.
Show the logged data with compatible format for offline frequency response estimation.
SigGenDataLog
SigGenDataLog = struct with fields:
           Ready: [1×1 timeseries]
    Perturbation: [1×1 timeseries]
      PlantInput: [1×1 timeseries]
     PlantOutput: [1×1 timeseries]
            Info: [1×1 struct]
The Ready field is a timeseries containing a logical signal that indicates which time steps contain the data to used for the estimation. For a sinestream signal, this field indicates which perturbation periods for the estimation to discard (settling periods). Perturbation contains the sinestream perturbation applied to the plant. The PlantInput and PlantOutput timeseries contain the plant input and output signals.
Estimate Frequency Response
You can use the data to perform frequency response estimation offline, using the frestimate command.
Use the SigGenDataLog structure and specified frequencies as inputs to the frestimate command. frestimate processes SigGenDataLog to obtain a frequency response data (frd) model containing the estimated responses at specified frequencies.
sys_estim_sinestream = frestimate(SigGenDataLog,w,"rad/s");
size(sys_estim_sinestream)
FRD model with 1 outputs, 1 inputs, and 20 frequency points.
Use PRBS Signal Generator Block
This section uses a model with a PRBS Signal Generator block preconfigured to inject perturbation signal for offline frequency response estimation.
Open the model.
mdl = "scdboostconverterZPRBSSigGen.slx";
open_system(mdl)
Signal Parameter Settings
The block is configured to generate a PRBS signal to cover the same the frequency range as in the Sinestream Signal Generator block in the previous section. For this example, use a value of 1 for Number of periods and 16 for Signal order. Set the amplitude of the PRBS signal to 1. After you configure the block and click the Apply button, the block parameters display Signal Length information based on the parameter settings. You must configure the start/stop port such that the signal injects for at least that long for comprehensive experiments.

Collect Experiment Data
The Data Logging for 'frestimate' subsystem collects experiment data in a data object SigGenDataLog. Besides the Ready signal, the subsystem also logs the Perturbation, PlantInput, and PlantOutput signals in the data object. The Info field of logged data also saves the value for the Number of periods parameter of the PRBS input signal.

Simulate the model.
sim(mdl)
The signal generator block injects the generated PRBS perturbation signal through the current source. Using PRBS perturbation signal, the simulation time for the experiment is much shorter as compared to estimation with sinestream signals.
Show the logged data with compatible format for offline frequency response estimation.
SigGenDataLog
SigGenDataLog = struct with fields:
           Ready: [1×1 timeseries]
    Perturbation: [1×1 timeseries]
      PlantInput: [1×1 timeseries]
     PlantOutput: [1×1 timeseries]
            Info: [1×1 struct]
The Ready field is a timeseries containing a logical signal that indicates the duration of the PRBS signal. Perturbation contains the PRBS perturbation applied to the plant. The PlantInput and PlantOutput timeseries contain the plant input and output signals.
Estimate Frequency Response
You can use the data to perform frequency response estimation offline, using the frestimate command.
Use the SigGenDataLog structure and specified frequencies as inputs to the frestimate command. frestimate processes SigGenDataLog to obtain a frequency response data (frd) model containing the estimated responses at specified frequencies.
sys_estim_prbs = frestimate(SigGenDataLog,w,"rad/s");
size(sys_estim_prbs)
FRD model with 1 outputs, 1 inputs, and 20 frequency points.
Examine Estimated Frequency Response
Compare the frequency response estimation results to analytical transfer function derivation.
figure;
bode(c2d(Zout,Ts),"b-",{10,1e6});
hold on;
bode(sys_estim_sinestream,"r*",sys_estim_prbs,"ko");
legend("Analytical result","Sinestream Signal Generator",...
    "PRBS Signal Generator","Location","southwest");

The output impedance measurements obtained using the signal generator blocks match well with the analytical transfer function.
You can use either the Sinestream Signal Generator or the PRBS Signal Generator blocks to conduct output impedance measurement in the boost converter model. However, with PRBS input signals, you can usually achieve satisfactory results in a much shorter simulation time compared to the estimation with sinestream signals to cover the desired frequency range.
For an example that shows how to use the frestimate to measure the output impedance, see Frequency Response Estimation to Measure Input Admittance and Output Impedance of Boost Converter.
See Also
frestimate | Sinestream Signal
Generator | PRBS Signal
Generator
Topics
- Frequency Response Estimation to Measure Input Admittance and Output Impedance of Boost Converter
- Generate PRBS Input Signals Using PRBS Signal Generator Block
- Use Sinestream Signal Generator Block for Offline Frequency Response Estimation
- Use Start-Stop Generator and PRBS Signal Generator Blocks for Estimation at Multiple Operating Points