Generate PRBS Input Signals Using PRBS Signal Generator Block
This example shows how to use the PRBS Signal Generator block to create a pseudo-random binary sequence (PRBS) input signal for offline frequency response estimation experiment. In practice, you can use this approach to perform the experiment in real time against a physical plant. In addition, this example shows how to use the Start-Stop Generator block to inject multiple PRBS input signals at different operating conditions.
Linear Plant Model
This section uses a model that already contains a PRBS Signal Generator block configured to inject perturbation signal for offline frequency response estimation. Open the model.
mdl = "PRBSSigGenForOfflineFREDataLogging.slx";
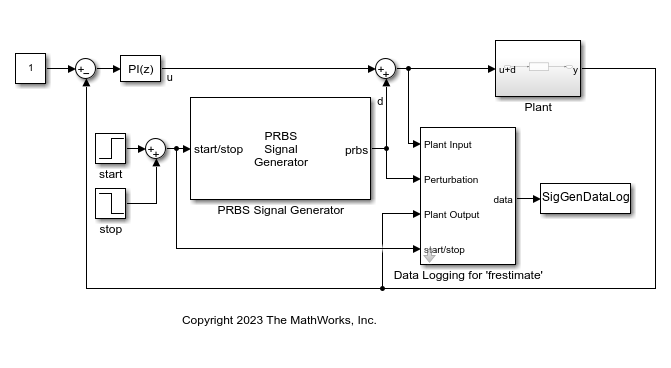
open_system(mdl)The model contains a plant in a closed-loop configuration with a PI controller. The PRBS Signal Generator block feeds a perturbation signal in addition to the control signal into the plant input. The plant model is the same as in the example Collect Frequency Response Experiment Data for Offline Estimation. The Data Logging for 'frestimate' subsystem collects both the perturbation and response signal data.
PRBS Signal Parameter Settings
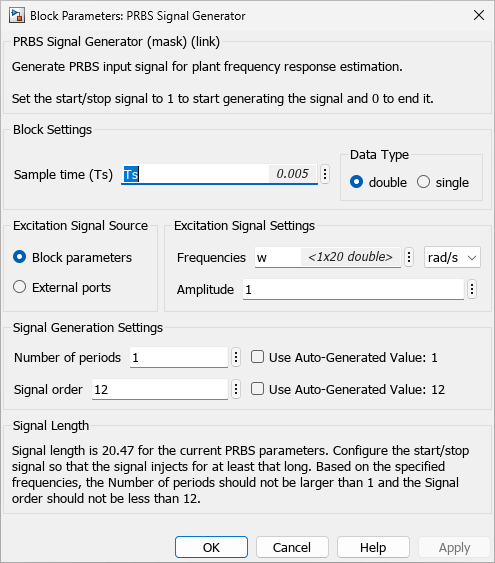
The block is configured to generate a PRBS signal for the frequencies range from 1 to 100 rad/s. Based on the sample time and frequencies, the block suggests auto-generated PRBS signal parameter values. For this example, the block suggests a value of 1 for Number of periods and 12 for Signal order. After you configure the block and click the Apply button, the block parameters display Signal Length information based on the parameter settings. You must configure the start/stop port such that the signal injects for at least that long for comprehensive experiments.
Collect Experiment Data
The Data Logging for 'frestimate' subsystem collects experiment data in a data object SigGenDataLog. Besides the Ready signal, the subsystem also logs the Perturbation, PlantInput, and PlantOutput signals in the data object. The Info field of logged data also saves the value for the Number of periods parameter of the PRBS input signal.

Simulate the model.
sim(mdl)
The signal generator block injects the generated PRBS perturbation signal in the closed loop. Since the PI controller is still in the loop, you can conduct frequency response estimation experiment at the desired operating points. Using PRBS perturbation signal, the simulation time for the experiment is much shorter when compared to sinestream input signal.
Show the logged data with compatible format for offline frequency response estimation.
SigGenDataLog
SigGenDataLog = struct with fields:
           Ready: [1×1 timeseries]
    Perturbation: [1×1 timeseries]
      PlantInput: [1×1 timeseries]
     PlantOutput: [1×1 timeseries]
            Info: [1×1 struct]
The Ready field is a timeseries containing a logical signal that indicates the duration of the PRBS signal. Perturbation contains the PRBS perturbation applied to the plant. The PlantInput and PlantOutput timeseries contain the plant input and output signals.
Estimate Frequency Response
You can use the data to perform frequency response estimation offline, using the frestimate command.
Use the SigGenDataLog structure and specified frequencies as inputs to the frestimate command. frestimate processes SigGenDataLog to obtain a frequency response data (frd) model containing the estimated responses at specified frequencies.
sys_estim = frestimate(SigGenDataLog,w,'rad/s');
size(sys_estim)
FRD model with 1 outputs, 1 inputs, and 20 frequency points.
Examine Estimated Frequency Response
You can compare the frequency response estimation result against what is obtained in the example Collect Frequency Response Experiment Data for Offline Estimation.
load("FREResultComparisonForPRBS.mat");
linsys = c2d(tf(10,[1 10 1000]),0.005);
opts = bodeoptions;
opts.XLim = [1 100];
opts.YLim = {[-60 -25];[-200 0]};
figure
bode(linsys,"k-",sys_estim,"b*",sys_freblk,"ro",opts);
legend("Linear Plant Model","Using PRBS Signal Generator",...
        "Using Frequency Response Estimator","Location","southwest");
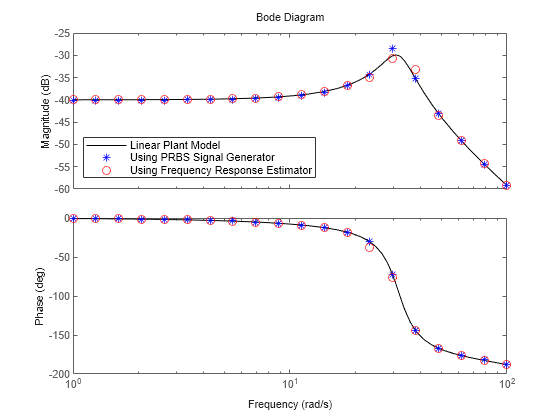
The Bode plot shows identical frequency response estimation results. With PRBS input signals, you can usually achieve satisfactory results in a much shorter simulation compared to estimation with sinestream signals. Compared to the Frequency Response Estimator block, the PRBS Signal Generator block is more flexible and provides better customization for the signal parameters. More importantly, you can use the signal generator blocks to reduce the hardware requirement in a deployed environment with limited computational resources.
See Also
frestimate | Sinestream Signal
Generator | PRBS Signal
Generator