Use Start-Stop Generator and PRBS Signal Generator Blocks for Estimation at Multiple Operating Points
This example shows how to use the signal generator blocks with the Start-Stop Generator block. Using the Start-Stop Generator block, you can generate and inject multiple PRBS perturbation signals in one simulation.
The example provides a model preconfigured with the Start-Stop Generator and PRBS Signal Generator blocks to inject a PRBS perturbation signal at multiple operating points.
mdlMultiInjection = "PRBSSigGenWithStartStopGenSpeedCtrl";
open_system(mdlMultiInjection)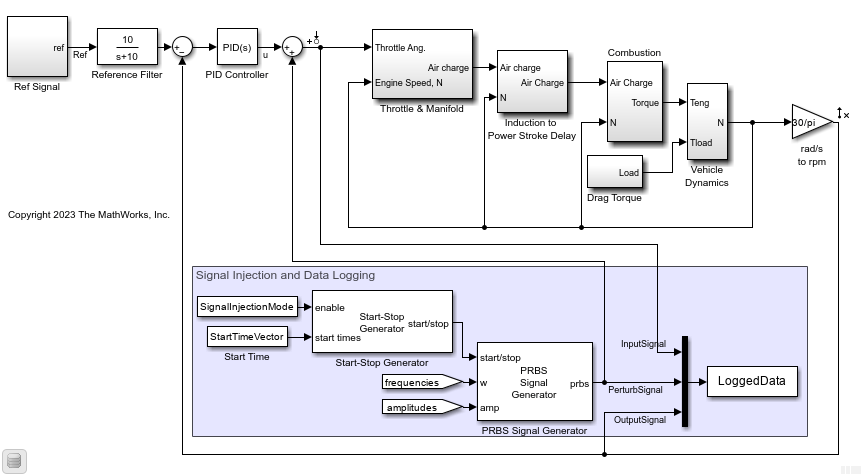
By default, the SignalInjectionMode value is set to 0. Therefore, the Start-Stop Generator block does not generate a start/stop signal and the PRBS Signal Generator does not inject any perturbation in the plant.
You can batch linearize the plant model to obtain the linear system corresponding to different rotation speeds at 2000, 3000, and 4000 rpm. The plant model is configured to follow a staircase speed reference signal at these rotation speeds in one simulation. You linearize at three snapshot times [48 98 148] seconds.
Linearize the model.
linsys = linearize(mdlMultiInjection,...
        getlinio(mdlMultiInjection),StartTimeVector+StartStopDuration);
Use External Ports for Signal Generator Block Parameter Settings
In this model, you use external ports to provide frequencies and amplitudes. Here, you can also use the auto-generated parameter values to generate a PRBS signal that covers the interested frequency range for each injection period.
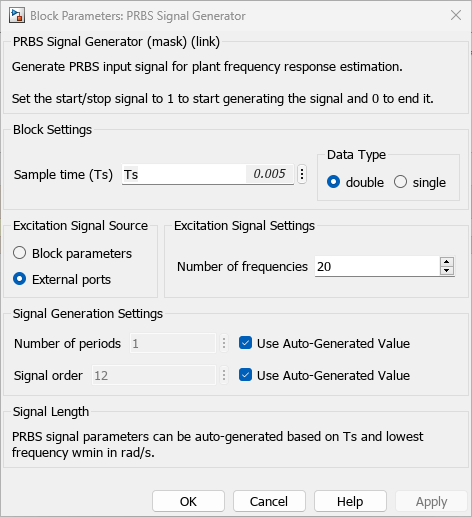
The block generates different PRBS signal parameters based on the different frequency ranges you provide through the external port. Additionally, you also specify a different value for the signal amplitude during each injection interval. For 2000 rpm, the frequency range is [1 500] rad/s with an amplitude of 0.4; for 3000 rpm, the frequency range is [2 500] rad/s with an amplitude of 0.4; for 4000 rpm, the frequency range is [3 500] rad/s with an amplitude of 0.3.
Enable the Start-Stop Generator block and simulate the model.
SignalInjectionMode = 1;
simOut = sim(mdlMultiInjection,"StopTime","150");
Process Logged Data for State-Space Model Estimation
After simulation, to post-process the logged data, extract the perturbation signals and the corresponding responses. Then, based on the logged data, you can estimate state-space models using either the n4sid or ssest commands. To do so, follow these steps:
Extract the signal timeseries during perturbation signal injection interval.
Detrend the logged data to remove the nominal constant values.
Construct input-output data object
iddatafor system identification.Use
n4sidandssestto estimate state-space linear system models fromiddataobjects.
nonzero_idx = find(simOut.LoggedData.Data(:,2));
initialidx = 1;
for ct = 1:numel(StartTimeVector)
    subidx = find(simOut.LoggedData.Time <= 50*ct);
    subidx = find(subidx >= initialidx);
    initialidx = subidx(end)+1;
    loggedDataTS= getsamples(simOut.LoggedData,...
        nonzero_idx(ismember(nonzero_idx,subidx)));
    loggedDataTSdetrend = detrend(loggedDataTS,"constant");
    inputsignal = loggedDataTSdetrend.Data(:,1);
    perturbsignal = loggedDataTSdetrend.Data(:,2);
    outputsignal = loggedDataTSdetrend.Data(:,3);

    data = iddata(outputsignal,inputsignal,Ts);
    sys_n4sid(:,:,ct,1) = n4sid(detrend(data),4,"cov","none");

    sysfromfre(:,:,ct,1) = ssest(inputsignal,outputsignal,4,"Ts",Ts);
end
Examine State-Space Models
Compare the results for each speed obtained from different processing methods in individual Bode plots.
opt = bodeoptions;
opt.PhaseMatching = "on";
opt.PhaseMatchingFreq = 0.1;
opt.PhaseMatchingValue = 360;
for ct = 1:numel(StartTimeVector)
    figure;
    bodeplot(sys_n4sid(:,:,ct,1),"k-",...
         sysfromfre(:,:,ct,1),"b-",c2d(linsys(:,:,ct,1),Ts),"r--",opt);
    legend("State-space model using n4sid",...
        "State-space model using ssest","Linearization result","Location","southwest");
end
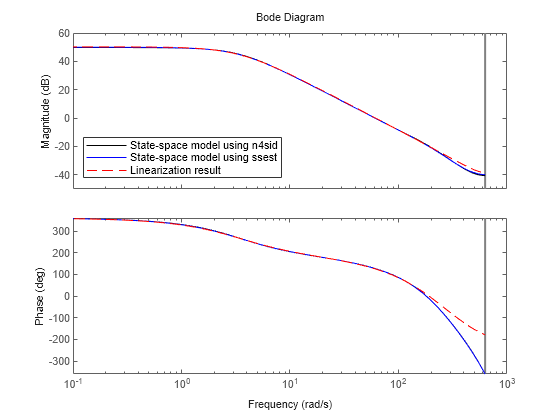

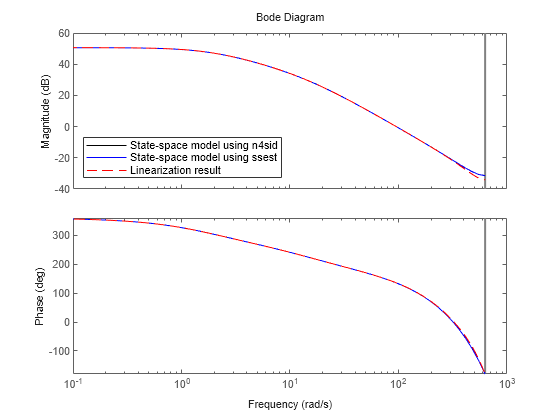
These Bode plots show that the state-space models identified using the Signal Generator blocks match well with the linearization results.
You can use the PRBS Signal Generator block to conduct offline frequency response estimation at one or multiple operating points. With PRBS input signals, you can usually achieve satisfactory results in a much shorter simulation compared to estimation with sinestream signals over the same frequency range. Compared to the Frequency Response Estimator block, the PRBS Signal Generator block is more flexible and provides better customization for the signal parameters. More importantly, you can use the signal generator blocks to reduce the hardware requirement in a deployed environment with limited computational resources. Additionally, using Start-Stop Generator block, you can easily configure multiple signal injections at different steady state operating points.
See Also
frestimate | Sinestream Signal
Generator | PRBS Signal
Generator