산점 데이터 보간하기
산점 데이터
산점 데이터는 점 집합 X와 대응값 V로 구성되며, 이때 점의 상대 위치 간에는 어떤 특정한 구조나 순서가 정해져 있지 않습니다. 산점 데이터를 보간하기 위한 접근 방식에는 여러 가지가 있습니다. 그중 널리 사용되는 한 가지 접근 방식은 점의 들로네 삼각분할(Delaunay Triangulation)을 사용하는 것입니다.
이 예제에서는 점을 삼각분할하고 꼭짓점을 크기 V만큼 X에 직교하는 차원으로 올려서 보간 곡면을 생성하는 방법을 보여줍니다.
이 방식을 적용할 수 있는 방법은 다양합니다. 이 예제에서 보간은 별도의 단계로 나뉩니다. 일반적으로 전체 보간 과정은 한 번의 함수 호출로 수행됩니다.
포물면에 산점 데이터 세트를 만듭니다.
X = [-1.5 3.2; 1.8 3.3; -3.7 1.5; -1.5 1.3; ...
      0.8 1.2; 3.3 1.5; -4.0 -1.0; -2.3 -0.7;
      0 -0.5; 2.0 -1.5; 3.7 -0.8; -3.5 -2.9; ...
      -0.9 -3.9; 2.0 -3.5; 3.5 -2.25];
V = X(:,1).^2 + X(:,2).^2;
hold on
plot3(X(:,1),X(:,2),zeros(15,1), '*r')
axis([-4, 4, -4, 4, 0, 25]);
grid
stem3(X(:,1),X(:,2),V,'^','fill')
hold off
view(322.5, 30);
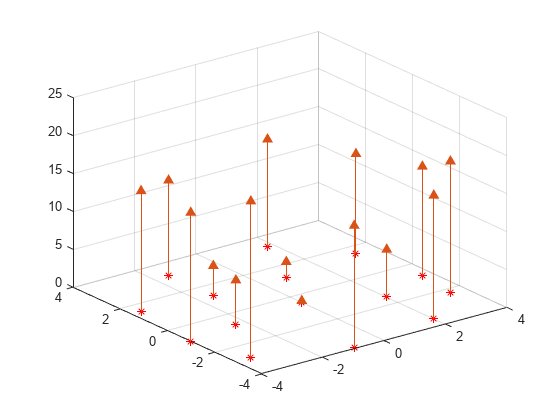
들로네 삼각분할을 만들고 꼭짓점을 위로 올린 다음 쿼리 점 Xq에서 보간 함수를 실행합니다.
figure('Color', 'white')
t = delaunay(X(:,1),X(:,2));

hold on

trimesh(t,X(:,1),X(:,2), zeros(15,1), ...
    'EdgeColor','r', 'FaceColor','none')
defaultFaceColor  = [0.6875 0.8750 0.8984];
trisurf(t,X(:,1),X(:,2), V, 'FaceColor', ...
    defaultFaceColor, 'FaceAlpha',0.9);
plot3(X(:,1),X(:,2),zeros(15,1), '*r')
axis([-4, 4, -4, 4, 0, 25]);
grid
plot3(-2.6,-2.6,0,'*b','LineWidth', 1.6)
plot3([-2.6 -2.6]',[-2.6 -2.6]',[0 13.52]','-b','LineWidth',1.6)
hold off

view(322.5, 30);

text(-2.0, -2.6, 'Xq', 'FontWeight', 'bold', ...
'HorizontalAlignment','center', 'BackgroundColor', 'none');
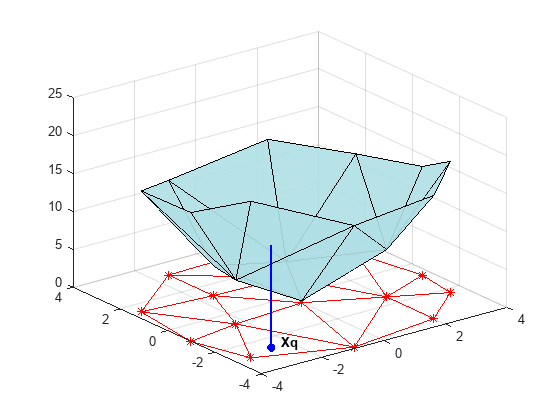
일반적으로 이 단계에서는 쿼리 점을 둘러싸는 삼각형을 구하기 위해 삼각분할 데이터 구조체를 순회하는 과정이 있습니다. 해당 지점을 찾은 후에는 보간 방법에 따라 값을 계산하는 후속 단계를 수행합니다. 근방에 있는 가장 가까운 점을 계산하고 그 점의 값을 사용할 수 있습니다(최근접이웃 보간 방법). 둘러싸는 삼각형의 3개 꼭짓점 값에 가중치를 적용하여 합을 계산할 수도 있습니다(선형 보간 방법). 이러한 방법과 해당 방법의 변형은 산점 데이터 보간에 대한 본문 및 참고 문헌에서 다룹니다.
여기에서는 2차원 보간을 중점적으로 설명하지만 이 기법을 더 높은 차원에 적용할 수 있습니다. 좀 더 일반적으로, 점 집합 X와 대응값 V가 주어진 경우 V = F(X) 형식의 보간 함수를 생성할 수 있습니다. 쿼리 점 Xq에서 보간 함수를 실행할 수 있습니다. 즉, Vq = F(Xq)가 됩니다. 이는 단일 값 함수입니다. 즉, X의 컨벡스 헐 내에 있는 임의의 쿼리 점 Xq에 대해 고유한 값 Vq를 생성합니다. 만족스러운 보간을 얻기 위해 샘플 데이터가 이 속성을 따르는 것으로 가정합니다.
MATLAB®은 삼각분할에 기반한 산점 데이터 보간을 수행할 수 있는 다음 두 가지 방법을 제공합니다.
griddata 함수를 사용하면 2차원 산점 데이터의 보간을 수행할 수 있습니다. griddatan 함수를 사용하면 N차원 산점 데이터의 보간을 수행할 수 있습니다. 그러나 6차원이 넘는 차원에서 보간을 수행하는 것은 삼각분할에 필요한 메모리가 기하급수적으로 증가하므로 중간 규모나 큰 규모의 점 집합에는 잘 사용되지 않습니다.
scatteredInterpolant 클래스를 사용하면 2차원과 3차원 공간에서 산점 데이터의 보간을 수행할 수 있습니다. 이 클래스는 위의 두 함수보다 더 효율적이고 더 다양한 보간 문제에 쉽게 적용할 수 있으므로 이 클래스를 사용하는 것이 권장됩니다.
griddata와 griddatan을 사용하여 산점 데이터 보간하기
griddata 함수와 griddatan 함수는 샘플 점 집합 X, 대응값 V, 쿼리 점 Xq를 받아 보간된 값 Vq를 반환합니다. 호출하는 구문은 두 함수 모두 비슷합니다. 주요 차이점은 2차원과 3차원에서 griddata 함수를 사용하면 X, Y 좌표와 X, Y, Z 좌표로 점을 정의할 수 있다는 것입니다. 이 두 함수는 미리 정의된 그리드 점 위치에서 산점 데이터를 보간하며, 그리딩된 데이터를 생성하는 데 목적이 있습니다. 이에 맞게 함수 이름이 지정된 것입니다. 실제로 보간은 더 일반적으로 사용됩니다. 점의 컨벡스 헐(Convex Hull) 내에 있는 임의 위치에서 쿼리할 수도 있습니다.
이 예제에서는 griddata 함수가 그리드 점 집합에서 산점 데이터를 보간하고 이 그리딩된 데이터를 사용하여 등고선 플롯을 만드는 방법을 보여줍니다.
seamount 데이터 세트를 플로팅합니다(seamount는 해저산을 의미함). 이 데이터 세트는 경도(x) 및 위도(y) 위치값의 집합과, 이러한 좌표에서 측정된 대응하는 seamount 고도값(z)으로 구성되어 있습니다.
load seamount
plot3(x,y,z,'.','markersize',12)
xlabel('Longitude')
ylabel('Latitude')
zlabel('Depth in Feet')
grid on
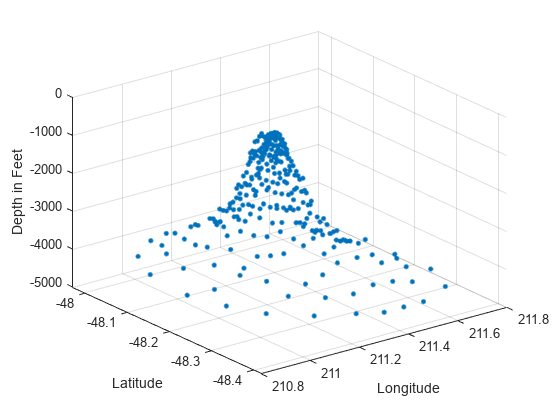
meshgrid를 사용하여 경도-위도 평면에 2차원 그리드 점 집합을 만든 다음 griddata를 사용하여 이들 점의 대응하는 깊이를 보간합니다.
figure
[xi,yi] = meshgrid(210.8:0.01:211.8, -48.5:0.01:-47.9);
zi = griddata(x,y,z,xi,yi);
surf(xi,yi,zi);
xlabel('Longitude')
ylabel('Latitude')
zlabel('Depth in Feet')
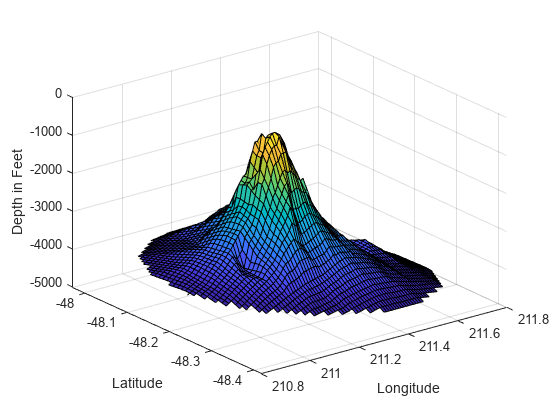
이제 데이터가 그리딩된 형식이므로 등고선을 계산하고 플로팅합니다.
figure
[c,h] = contour(xi,yi,zi);
clabel(c,h);
xlabel('Longitude')
ylabel('Latitude')
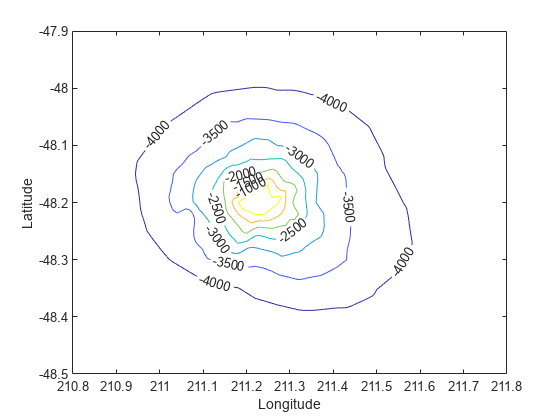
griddata를 사용하여 데이터셋의 컨벡스 헐 내에 있는 임의 위치에서 보간할 수도 있습니다. 예를 들어, 좌표 (211.3, -48.2)의 깊이는 다음과 같이 지정합니다.
zi = griddata(x,y,z, 211.3, -48.2);
griddata 함수가 호출될 때마다 기본 삼각분할이 계산됩니다. 따라서 여러 쿼리 점에서 동일한 데이터 세트를 반복적으로 보간할 경우 성능에 영향을 미칠 수 있습니다. 이러한 측면에서는 scatteredInterpolant 클래스를 사용하여 산점 데이터 보간하기에서 설명하는 scatteredInterpolant 클래스가 더 효율적입니다.
MATLAB은 더 높은 차원에서 보간할 수 있도록 griddatan도 제공합니다. 호출하는 구문은 griddata와 비슷합니다.
scatteredInterpolant 클래스
griddata 함수는 미리 정의된 그리드 점 위치 세트에서 값을 보간해야 할 때 유용합니다. 실제로 보간 문제는 더 일반적이며, scatteredInterpolant 클래스는 더 나은 유연성을 제공합니다. 이 클래스의 이점은 다음과 같습니다.
효율적으로 쿼리할 수 있는 보간 함수를 생성합니다. 즉, 기본 삼각분할이 한 번 만들어진 후 이후 쿼리에 재사용됩니다.
삼각분할과 관계없이 보간 방법을 변경할 수 있습니다.
삼각분할과 관계없이 데이터 점의 값을 변경할 수 있습니다.
전체를 재계산할 필요 없이 기존 보간 함수에 데이터 점을 점진적으로 추가할 수 있습니다. 편집된 점의 개수가 총 샘플 점의 개수에 비해 많지 않을 경우 데이터 점을 효율적으로 제거하고 이동할 수도 있습니다.
컨벡스 헐(Convex Hull) 바깥쪽에 있는 점의 근사치를 구할 수 있는 외삽 기능을 제공합니다. 자세한 내용은 산점 데이터 외삽하기 항목을 참조하십시오.
scatteredInterpolant는 다음과 같은 보간 방법을 제공합니다.
'nearest'— 최근접이웃 보간으로, 보간 곡면이 불연속적입니다.'linear'— 선형 보간(디폴트 값)으로, 보간 곡면이 C0 연속적입니다.'natural'— 자연 이웃 보간(Natural Neighbor Interpolation)으로, 보간 곡면이 샘플 점에서를 제외하고 C1 연속적입니다.
scatteredInterpolant 클래스를 사용하면 2차원과 3차원 공간에서 산점 데이터의 보간을 수행할 수 있습니다. scatteredInterpolant를 호출하고 점 위치와 대응값, 그리고 선택적으로 보간 방법과 외삽 방법을 전달하여 보간 함수를 만들 수 있습니다. scatteredInterpolant를 만들고 실행하는 데 사용할 수 있는 구문에 대한 자세한 내용은 scatteredInterpolant 도움말 페이지를 참조하십시오.
scatteredInterpolant 클래스를 사용하여 산점 데이터 보간하기
이 예제에서는 scatteredInterpolant를 사용하여 peaks 함수의 산점 샘플링을 보간하는 방법을 보여줍니다.
산점 데이터 세트 생성하기.
rng default;
X = -3 + 6.*rand([250 2]);
V = peaks(X(:,1),X(:,2));
보간 함수 생성하기.
F = scatteredInterpolant(X,V)
F =
  scatteredInterpolant with properties:

                 Points: [250×2 double]
                 Values: [250×1 double]
                 Method: 'linear'
    ExtrapolationMethod: 'linear'
Points 속성은 데이터 점의 좌표를 나타내고, Values 속성은 관련 값을 나타냅니다. Method 속성은 보간을 수행하는 보간 방법을 나타냅니다. ExtrapolationMethod 속성은 쿼리 점이 컨벡스 헐 외부에 있을 때 사용되는 외삽 방법을 나타냅니다.
struct의 필드에 액세스하는 것과 같은 방법으로 F의 속성에 액세스할 수 있습니다. 예를 들어, F.Points를 사용하여 데이터 점의 좌표를 검토합니다.
보간 함수 실행하기.
scatteredInterpolant를 사용하면 첨자로 보간 함수를 실행할 수 있습니다. 이는 함수와 같은 방식으로 실행됩니다. 보간 함수를 다음과 같이 실행할 수 있습니다. 이 경우, 쿼리 위치의 값은 Vq로 반환됩니다. 다음과 같이 단일 쿼리 점에서 실행할 수 있습니다.
Vq = F([1.5 1.25])
Vq =
1.4838
개별 좌표를 전달할 수도 있습니다.
Vq = F(1.5, 1.25)
Vq =
1.4838
다음과 같이 점 위치로 구성된 벡터에서 실행할 수 있습니다.
Xq = [0.5 0.25; 0.75 0.35; 1.25 0.85];
Vq = F(Xq)
Vq = 3×1

    0.4057
    1.2199
    2.1639
그리드 점 위치에서 F를 실행하고 결과를 플로팅할 수 있습니다.
[Xq,Yq] = meshgrid(-2.5:0.125:2.5);
Vq = F(Xq,Yq);
surf(Xq,Yq,Vq);
xlabel('X','fontweight','b'), ylabel('Y','fontweight','b');
zlabel('Value - V','fontweight','b');
title('Linear Interpolation Method','fontweight','b');

보간 방법 변경하기.
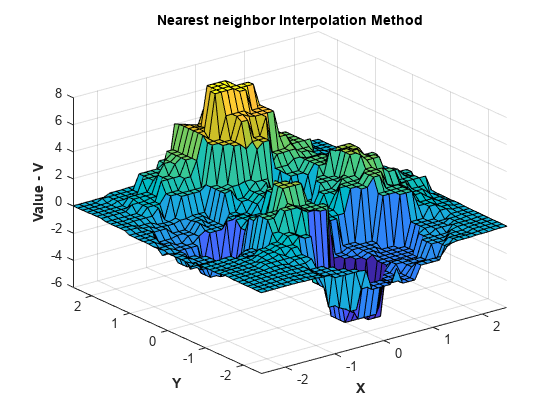
실행 중에 보간 방법을 변경할 수 있습니다. 방법을 'nearest'로 설정합니다.
F.Method = 'nearest';위에서처럼 보간 함수를 다시 실행하고 플로팅합니다.
Vq = F(Xq,Yq);
figure
surf(Xq,Yq,Vq);
xlabel('X','fontweight','b'),ylabel('Y','fontweight','b')
zlabel('Value - V','fontweight','b')
title('Nearest neighbor Interpolation Method','fontweight','b');
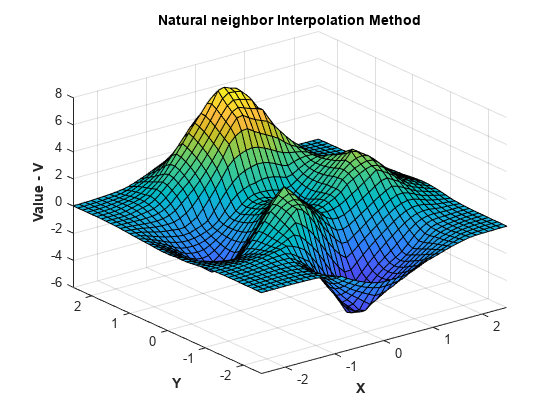
보간 방법을 자연 이웃 보간으로 변경하고 다시 실행한 후 결과를 플로팅합니다.
F.Method = 'natural';
Vq = F(Xq,Yq);
figure
surf(Xq,Yq,Vq);
xlabel('X','fontweight','b'),ylabel('Y','fontweight','b')
zlabel('Value - V','fontweight','b')
title('Natural neighbor Interpolation Method','fontweight','b');
샘플 데이터 위치의 값 바꾸기.
실행 중에 샘플 데이터 위치 X의 값 V를 변경할 수 있습니다. 일부 보간 문제는 동일한 위치에 여러 개의 값 세트를 가질 수 있으므로 이 방법은 실제로 유용합니다. 예를 들어, 위치(x, y, z)와 대응하는 속도 벡터(Vx, Vy, Vz)로 정의된 3차원 속도 필드를 보간하려 한다고 가정해 보겠습니다. 각 속도 성분을 차례로 값 속성(V)에 할당하여 이러한 속도 성분을 보간할 수 있습니다. 이렇게 하면 매번 새로운 보간 함수를 계산할 필요 없이 동일한 보간 함수를 재사용할 수 있으므로 오버헤드를 줄여 성능이 크게 향상됩니다.
다음 단계에서는 위의 예제에서 값을 변경하는 방법을 보여줍니다. 표현식 을 사용하여 값을 계산할 것입니다.
V = X(:,1).*exp(-X(:,1).^2-X(:,2).^2);
F.Values = V;
보간 함수를 실행하고 결과를 플로팅합니다.
Vq = F(Xq,Yq);
figure
surf(Xq,Yq,Vq);
xlabel('X','fontweight','b'), ylabel('Y','fontweight','b')
zlabel('Value - V','fontweight','b')
title('Natural neighbor interpolation of v = x.*exp(-x.^2-y.^2)')

기존 보간 함수에 점 위치와 값 추가하기.
이렇게 하면 추가된 데이터 세트 전체를 다시 계산하는 것과는 달리 효율적으로 업데이트할 수 있습니다.
샘플 데이터를 추가할 때는 점 위치와 대응값을 모두 추가하는 것이 중요합니다.
위 예제를 계속 사용하며, 다음과 같이 새 샘플 점을 만듭니다.
X = -1.5 + 3.*rand(100,2);
V = X(:,1).*exp(-X(:,1).^2-X(:,2).^2);
새 점과 대응값을 삼각분할에 추가합니다.
F.Points(end+(1:100),:) = X;
F.Values(end+(1:100)) = V;
조정된 보간 함수를 실행하고 결과를 플로팅합니다.
Vq = F(Xq,Yq);
figure
surf(Xq,Yq,Vq);
xlabel('X','fontweight','b'), ylabel('Y','fontweight','b');
zlabel('Value - V','fontweight','b');

보간 함수에서 데이터 제거하기.
보간 함수에서 샘플 데이터 점을 점진적으로 제거할 수 있습니다. 보간 함수에서 데이터 점과 대응값을 제거할 수도 있습니다. 이는 거짓 이상값을 제거하는 데 유용합니다.
샘플 데이터를 제거할 때는 점 위치와 대응값을 모두 제거하는 것이 중요합니다.
25번째 점을 제거합니다.
F.Points(25,:) = [];
F.Values(25) = [];
점 5에서 15까지 제거합니다.
F.Points(5:15,:) = [];
F.Values(5:15) = [];
150개의 점만 유지하고 나머지는 제거합니다.
F.Points(150:end,:) = [];
F.Values(150:end) = [];
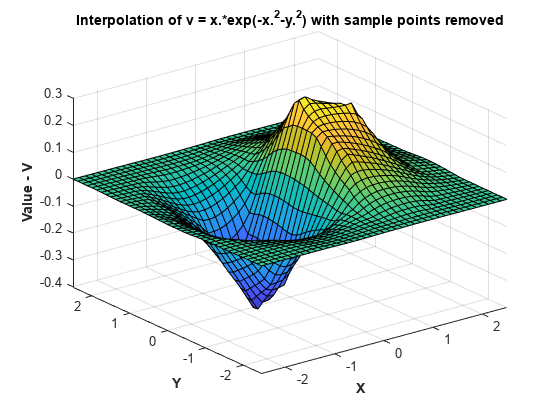
그러면 다음과 같이 보간 함수를 실행하고 플로팅할 때 더 성긴 곡면이 생성됩니다.
Vq = F(Xq,Yq);
figure
surf(Xq,Yq,Vq);
xlabel('X','fontweight','b'), ylabel('Y','fontweight','b');
zlabel('Value - V','fontweight','b');
title('Interpolation of v = x.*exp(-x.^2-y.^2) with sample points removed')
복소수 산점 데이터의 보간
이 예제에서는 각 샘플 위치의 값이 복소수인 경우를 위해 복소수 산점 데이터를 보간하는 방법을 보여줍니다.
샘플 데이터를 만듭니다.
rng('default')
X = -3 + 6*rand([250 2]);
V = complex(X(:,1).*X(:,2), X(:,1).^2 + X(:,2).^2);
보간 함수를 만듭니다.
F = scatteredInterpolant(X,V);
쿼리 점의 그리드를 만들고, 그리드 점에서 보간 함수를 실행합니다.
[Xq,Yq] = meshgrid(-2.5:0.125:2.5);
Vq = F(Xq,Yq);
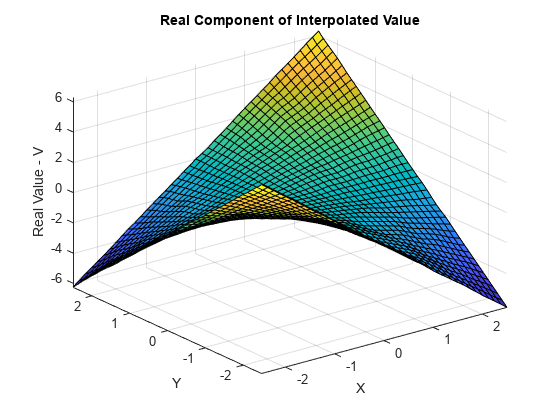
Vq의 실수부를 플로팅합니다.
VqReal = real(Vq);
figure
surf(Xq,Yq,VqReal);
xlabel('X');
ylabel('Y');
zlabel('Real Value - V');
title('Real Component of Interpolated Value');
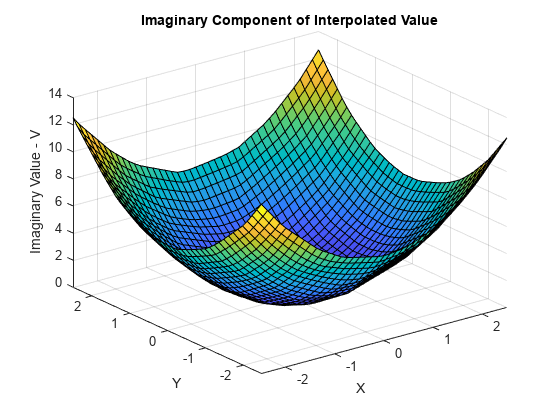
Vq의 허수부를 플로팅합니다.
VqImag = imag(Vq);
figure
surf(Xq,Yq,VqImag);
xlabel('X');
ylabel('Y');
zlabel('Imaginary Value - V');
title('Imaginary Component of Interpolated Value');
산점 데이터 보간 문제 해결하기
이전 섹션에 나온 여러 예제에서는 매끄러운 곡면에 샘플링된 점 집합을 보간하는 방법을 다뤘습니다. 또한 점 간의 간격도 비교적 균일했습니다. 예를 들어, 점 무리들이 비교적 큰 거리만큼 떨어져 있지 않았습니다. 뿐만 아니라, 보간 함수가 점 위치의 컨벡스 헐(Convex Hull) 내에서 잘 실행되었습니다.
실제 보간 문제를 처리할 때는 데이터가 좀 더 예측 불가능할 수 있습니다. 이는 부정확한 측정값이나 이상값을 생성할 수 있는 측정 기기 때문일 수 있습니다. 기본 데이터가 매끄럽게 변화하지 않을 수 있으며, 값이 점 간에 불쑥 급증할 수 있습니다. 이 섹션에서는 산점 데이터 보간과 관련된 문제를 식별하고 해결할 수 있는 몇 가지 지침을 제공합니다.
NaN을 포함하는 입력 데이터
NaN 값을 포함하는 샘플 데이터는 보간에 사용할 수 없으므로, 이러한 데이터를 전처리하여 NaN 값을 제거해야 합니다. NaN을 제거한 경우 일관성 유지를 위해 해당하는 데이터 값과 좌표도 제거해야 합니다. 샘플 데이터에 NaN 값이 있으면 생성자를 호출할 때 오류가 발생합니다.
다음 예제에서는 NaN을 제거하는 방법을 보여줍니다.
다음과 같이 데이터를 만들고 일부 요소를 NaN으로 바꿉니다.
x = rand(25,1)*4-2;
y = rand(25,1)*4-2;
V = x.^2 + y.^2;

x(5) = NaN; x(10) = NaN; y(12) = NaN; V(14) = NaN;
F = scatteredInterpolant(x,y,V);
NaN의 샘플 점 인덱스를 구한 다음 보간 함수를 생성합니다.nan_flags = isnan(x) | isnan(y) | isnan(V); x(nan_flags) = []; y(nan_flags) = []; V(nan_flags) = []; F = scatteredInterpolant(x,y,V);
NaN 값으로 바꿉니다.X = rand(25,2)*4-2; V = X(:,1).^2 + X(:,2).^2; X(5,1) = NaN; X(10,1) = NaN; X(12,2) = NaN; V(14) = NaN;
F = scatteredInterpolant(X,V);
nan_flags = isnan(X(:,1)) | isnan(X(:,2)) | isnan(V);

X(nan_flags,:) = [];
V(nan_flags) = [];

F = scatteredInterpolant(X,V);
보간 함수가 NaN 값을 출력하는 경우
'linear' 또는 'natural' 보간 방법을 사용하여 컨벡스 헐(Convex Hull) 외부의 점을 쿼리하면 griddata와 griddatan은 NaN 값을 반환합니다. 반면, 'nearest' 방법을 사용하여 동일한 점을 쿼리할 경우에는 숫자형 결과값이 반환됩니다. 이는 쿼리 점의 최근접이웃 점이 컨벡스 헐의 내부와 외부에 모두 있기 때문입니다.
컨벡스 헐 외부의 근삿값을 계산하려면 scatteredInterpolant를 사용해야 합니다. 자세한 내용은 산점 데이터 외삽하기 항목을 참조하십시오.
중복된 점의 위치 처리하기
입력 데이터는 "완벽한" 경우가 드물며, 적용 시 중복된 데이터 점 위치를 처리해야 할 수 있습니다. 데이터 세트에서 동일한 위치에 있는 둘 이상의 데이터 점이 서로 다른 대응값을 가질 수 있습니다. 이런 경우 scatteredInterpolant는 점들을 병합하고 대응값의 평균을 구합니다. 이 예제에서는 scatteredInterpolant가 중복 점을 갖는 데이터 세트에 대해 보간을 수행하는 방법을 보여줍니다.
평면 곡면에 있는 샘플 데이터를 만듭니다.
x = rand(100,1)*6-3;
y = rand(100,1)*6-3;

V = x + y;
지점 50의 좌표에 지점 100의 좌표를 할당하여 중복된 점 위치를 추가합니다.
x(50) = x(100);
y(50) = y(100);
보간 함수를 만듭니다.
F는 99개의 고유한 데이터 점을 포함하게 됩니다.F = scatteredInterpolant(x,y,V)
50번째 점에 연결된 값을 확인합니다.
F.Values(50)
이 값은 원래 50번째 값과 100번째 값의 평균입니다. 이 두 데이터 점의 위치가 같기 때문입니다.
(V(50)+V(100))/2
일부 보간 문제에서는 샘플 값 세트 여러 개의 위치가 동일할 수 있습니다. 예를 들어, 값 세트가 서로 다른 시간에 동일한 위치에 기록되었을 수 있습니다. 이 경우, 하나의 측정값 세트를 보간한 후에 값을 바꿔서 다음 세트를 보간하여 효율을 높일 수 있습니다.
중복된 점의 위치가 있는 경우에는 값을 바꿀 때 데이터 개수에 변경이 없도록 해야 합니다. 예를 들어, 100개의 데이터 점 위치와 연결된 두 개의 값 세트가 있고, 값을 바꿔서 각 세트를 차례로 보간하려 한다고 가정해 보겠습니다.
다음 두 개의 값 세트가 있다고 가정합니다.
V1 = x + 4*y;
V2 = 3*x + 5*y
보간 함수를 만듭니다.
scatteredInterpolant는 중복된 위치를 병합하며, 보간 함수는 99개의 고유한 샘플 점을 포함합니다.F = scatteredInterpolant(x,y,V1)
F.Values = V2를 통해 직접 값을 바꾸면 99개 샘플에 100개의 값이 할당됩니다. 이전 병합 작업의 컨텍스트가 손실되어, 샘플 위치 개수와 샘플 값의 개수가 일치하지 않게 됩니다. 보간 함수가 쿼리를 지원하려면 불일치 문제를 해결해야 합니다.
이와 같이 좀 더 복잡한 경우에는, 보간 함수를 만들고 편집하기 전에 중복된 요소를 제거해야 합니다. unique 함수를 사용하여 고유한 점의 인덱스를 구합니다. unique는 중복된 점의 인덱스를 식별하는 인수를 출력할 수도 있습니다.
[~, I, ~] = unique([x y],'first','rows');
I = sort(I);
x = x(I);
y = y(I);
V1 = V1(I);
V2 = V2(I);
F = scatteredInterpolant(x,y,V1)
F를 사용하여 첫 번째 데이터 세트를 보간할 수 있습니다. 그런 다음, 값을 바꿔서 두 번째 데이터 세트를 보간할 수 있습니다.F.Values = V2;
scatteredInterpolant를 편집할 때 효율성 실현
scatteredInterpolant를 사용하여 샘플 값(F.Values)과 보간 방법(F.Method)을 나타내는 속성을 편집할 수 있습니다. 이러한 속성은 기본 삼각분할과 관련이 없으므로, 편집을 효율적으로 수행할 수 있습니다. 그러나, 예를 들어 큰 배열로 작업할 경우에는 데이터를 편집할 때 실수로 불필요한 복사본이 생성되지 않도록 주의해야 합니다. 둘 이상의 변수가 하나의 배열을 참조할 경우 이 배열을 편집하면 복사본이 생성됩니다.
다음과 같은 경우에는 복사본이 생성되지 않습니다.
A1 = magic(4)
A1(4,4) = 11
A1과 A2가 더 이상 동일한 데이터를 공유할 수 없습니다.A1 = magic(4) A2 = A1 A1(4,4) = 32
scatteredInterpolant는 데이터를 포함하고 이 데이터는 배열처럼 동작합니다. MATLAB에서는 이를 값 객체라고 합니다. MATLAB 언어는 애플리케이션이 파일에 있는 함수로 구성된 경우 최적의 성능을 제공하도록 설계되었습니다. 명령줄에서 프로토타이핑하면 같은 수준의 성능을 얻지 못할 수 있습니다.다음 예제에서는 이 동작을 보여줍니다. 그러나, 이 예제에서 볼 수 있는 성능상의 이점이 MATLAB의 다른 함수로 일반화될 수는 없습니다.
다음 코드는 최적의 성능을 제공하지 않습니다.
x = rand(1000000,1)*4-2;
y = rand(1000000,1)*4-2;
z = x.*exp(-x.^2-y.^2);
tic; F = scatteredInterpolant(x,y,z); toc
tic; F.Values = 2*z; toc
MATLAB은 파일에 있는 함수로 구성된 프로그램을 실행할 경우 코드 실행에 대한 전체적인 그림을 갖게 됩니다. 따라서 MATLAB이 성능을 최적화할 수 있습니다. 명령줄에 코드를 입력할 경우 MATLAB은 사용자가 다음에 무엇을 입력할지 예상할 수 없으므로 같은 수준의 최적화를 수행할 수 없습니다. 재사용 가능한 함수를 만들어 애플리케이션을 개발하는 것이 일반적이며, 권장되는 방법입니다. 이러한 경우 MATLAB은 성능을 최적화합니다.
컨벡스 헐(Convex Hull) 근처의 보간 결과는 좋지 않음
들로네 삼각분할(Delaunay Triangulation)은 좋은 결과를 생성하는 데 유리한 기하학적 특성을 가지므로 산점 데이터 보간 문제에 적합합니다. 이러한 특성은 다음과 같습니다.
등변에 더 가까운 형태의 삼각형이나 사면체를 위해 슬리버(Sliver) 형태의 삼각형이나 사면체 거부.
점 간의 최근접이웃 관계를 묵시적으로 정의하는, 빈 외접원 속성.
빈 외접원 특성으로 인하여, 보간된 값은 쿼리 위치 가까이에 있는 샘플 점의 영향을 받게 됩니다. 이러한 특성에도 불구하고, 어떤 경우에는 데이터 점의 분포에 따라 좋지 않은 결과가 나올 수 있습니다. 이는 대개 샘플 데이터 세트의 컨벡스 헐 근처에서 발생합니다. 예상치 못한 보간 결과가 생성될 경우 샘플 데이터와 기본 삼각분할의 플롯을 살펴보면 종종 문제를 파악하는 데 도움이 될 수 있습니다.
이 예제에서는 경계 근처의 보간 결과가 좋지 못한, 보간된 곡면을 보여줍니다.
경계 근처에서 문제가 생기게 될 샘플 데이터 세트를 만듭니다.
t = 0.4*pi:0.02:0.6*pi;
x1 = cos(t)';
y1 = sin(t)'-1.02;
x2 = x1;
y2 = y1*(-1);
x3 = linspace(-0.3,0.3,16)';
y3 = zeros(16,1);
x = [x1;x2;x3];
y = [y1;y2;y3];
이제, 이러한 샘플 점을 곡면 으로 올린 다음 곡면을 보간합니다.
z = x.^2 + y.^2;
F = scatteredInterpolant(x,y,z);
[xi,yi] = meshgrid(-0.3:.02:0.3, -0.0688:0.01:0.0688);
zi = F(xi,yi);
mesh(xi,yi,zi)
xlabel('X','fontweight','b'), ylabel('Y','fontweight','b')
zlabel('Value - V','fontweight','b')
title('Interpolated Surface');

실제 곡면은 다음과 같습니다.
zi = xi.^2 + yi.^2;
figure
mesh(xi,yi,zi)
title('Actual Surface')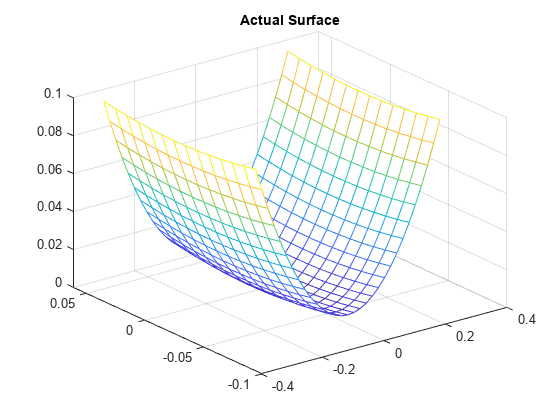
보간 곡면이 경계 근처에서 좋지 않은 결과를 만드는 이유를 이해하기 위해, 기본 삼각분할을 살펴보면 도움이 됩니다.
dt = delaunayTriangulation(x,y);
figure
plot(x,y,'*r')
axis equal
hold on
triplot(dt)
plot(x1,y1,'-r')
plot(x2,y2,'-r')
title('Triangulation Used to Create the Interpolant')
hold off
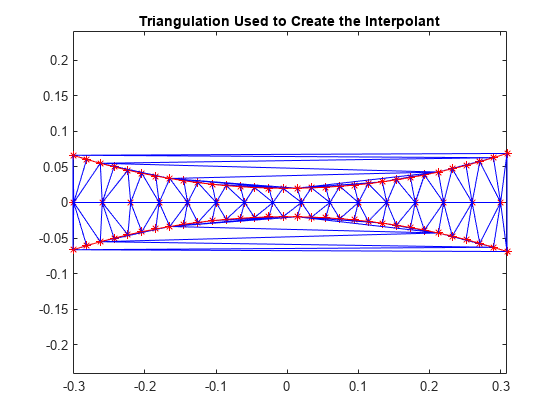
빨간색 경계 안쪽에 있는 삼각형은 비교적 그 형태가 양호합니다. 이들 삼각형은 근접해 있는 점들로부터 생성되었으며, 이 영역에서는 보간이 제대로 동작합니다. 빨간색 경계 바깥쪽에 있는 삼각형은 슬리버(Sliver)와 비슷하며, 서로 멀리 떨어져 있는 점을 연결합니다. 곡면을 정확히 캡처할 만큼 샘플링이 충분하지 않기 때문에, 이러한 영역의 결과가 좋지 못한 것은 놀라운 일이 아닙니다. 3차원에서 삼각분할을 시각적으로 검토하는 것은 좀 더 까다롭지만, 점 분포를 살펴보면 종종 잠재적인 문제를 파악하는 데 도움이 될 수 있습니다.
MATLAB® 4 griddata의 방법인 'v4'는 삼각분할에 기반한 것이 아니므로, 경계 근처에서 보간 곡면이 왜곡되는 영향을 받지 않습니다.
[xi,yi] = meshgrid(-0.3:.02:0.3, -0.0688:0.01:0.0688);
zi = griddata(x,y,z,xi,yi,'v4');
mesh(xi,yi,zi)
xlabel('X','fontweight','b'), ylabel('Y','fontweight','b')
zlabel('Value - V','fontweight','b')
title('Interpolated surface from griddata with v4 method','fontweight','b');
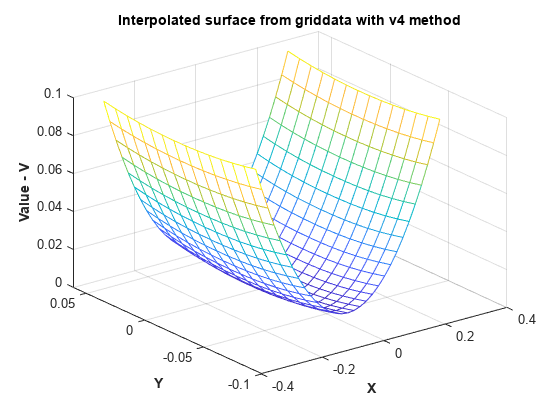
griddata에서 'v4' 방법을 사용하여 보간된 곡면은 예상되는 실제 곡면과 일치합니다.