산점 데이터 외삽하기
외삽의 정확도에 영향을 미치는 요인
scatteredInterpolant는 컨벡스 헐 바깥쪽에 있는 점의 근사치를 구할 수 있는 기능을 제공합니다. 'linear' 외삽 방법은 컨벡스 헐 경계에서의 기울기에 대한 최소제곱 근사법을 기반으로 합니다. 컨벡스 헐 바깥쪽 쿼리 점에 대해 반환되는 값은 경계의 값과 기울기에 따라 달라집니다. 해의 품질은 데이터를 얼마나 잘 샘플링했는지에 영향을 받습니다. 데이터가 성기게 샘플링되면 외삽 품질이 좋지 않게 됩니다.
또한, 컨벡스 헐 경계 근처의 삼각분할은 슬리버(Sliver) 같은 형태의 삼각형을 초래할 수 있습니다. 이러한 삼각형은 보간 결과에 좋지 않은 영향을 미치는 것과 마찬가지로 외삽 결과에도 좋지 않은 영향을 미칠 수 있습니다. 자세한 내용은 컨벡스 헐(Convex Hull) 근처의 보간 결과는 좋지 않음 항목을 참조하십시오.
영역 외부에서의 동작에 대한 지식을 바탕으로 외삽 결과를 시각적으로 검사해야 합니다.
성기게 샘플링된 산점 데이터와 정교하게 샘플링된 산점 데이터의 외삽 비교하기
이 예제에서는 샘플 포물선 함수의 두 가지 다른 샘플링을 보간하는 방법을 보여줍니다. 또한, 샘플 점의 분포 상태가 좋을수록 더 나은 외삽 결과를 얻을 수 있음을 보여줍니다.
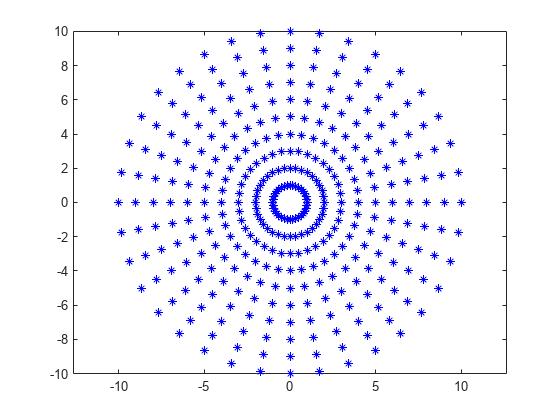
10개의 동심원 주위로 10도 간격으로 떨어져 있는 점의 방사형 분포를 만듭니다. bsxfun을 사용하여 좌표 와 를 계산합니다.
theta = 0:10:350;
c = cosd(theta);
s = sind(theta);
r = 1:10;

x1 = bsxfun(@times,r.',c);
y1 = bsxfun(@times,r.',s);

figure
plot(x1,y1,'*b')
axis equal
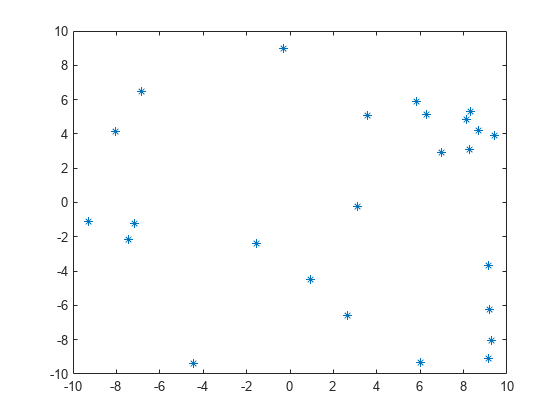
더 성기게 분포된 두 번째 점 집합을 만듭니다. rand 함수를 사용하여 범위 [-10, 10]에 임의의 샘플링을 생성합니다.
rng default;
x2 = -10 + 20*rand([25 1]);
y2 = -10 + 20*rand([25 1]);
figure
plot(x2,y2,'*')
두 점 집합 모두에 포물선 함수 v(x,y)를 샘플링합니다.
v1 = x1.^2 + y1.^2;
v2 = x2.^2 + y2.^2;
v(x,y)의 각 샘플링에 대해 scatteredInterpolant를 만듭니다.
F1 = scatteredInterpolant(x1(:),y1(:),v1(:));
F2 = scatteredInterpolant(x2(:),y2(:),v2(:));
각 영역을 벗어나는 쿼리 점의 그리드를 만듭니다.
[xq,yq] = ndgrid(-20:20);
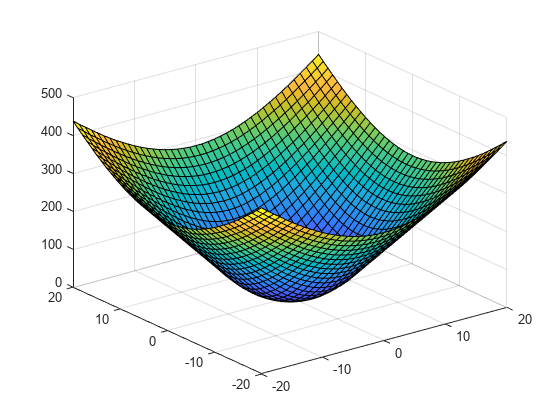
F1을 실행하고 결과를 플로팅합니다.
figure
vq1 = F1(xq,yq);
surf(xq,yq,vq1)
F2를 실행하고 결과를 플로팅합니다.
figure
vq2 = F2(xq,yq);
surf(xq,yq,vq2)
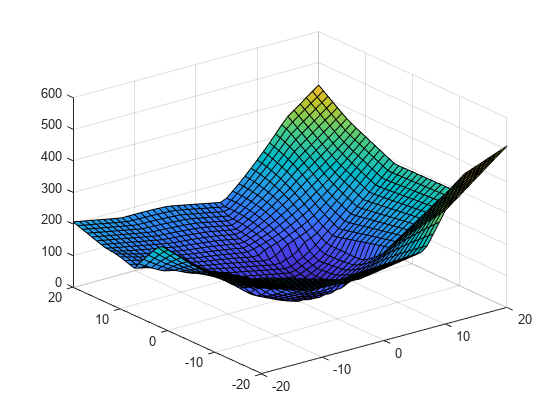
v2의 점은 성기게 샘플링되었기 때문에 F2에 대한 외삽 품질이 좋지 않게 나왔습니다.
3차원 데이터 외삽
이 예제에서는 잘 샘플링된 3차원 그리드 데이터셋을 scatteredInterpolant를 사용하여 외삽하는 방법을 보여줍니다. 쿼리 점은 완전히 영역 바깥쪽에 있는 평면 그리드에 있습니다.
샘플 점으로 구성된 10×10×10 그리드를 만듭니다. 각 차원의 점은 범위 [-10, 10]에 있습니다.
[x,y,z] = ndgrid(-10:10);
샘플 점에 함수 v(x,y,z)를 샘플링합니다.
v = x.^2 + y.^2 + z.^2;
선형 보간과 외삽 방식을 지정하여 scatteredInterpolant를 만듭니다.
F = scatteredInterpolant(x(:),y(:),z(:),v(:),'linear','linear');
범위 [-20,20]에 걸쳐 있는 x-y 그리드와 고도(Elevation) z = 15에서 대해 보간 함수를 실행합니다.
[xq,yq,zq] = ndgrid(-20:20,-20:20,15);
vq = F(xq,yq,zq);
figure
surf(xq,yq,vq)
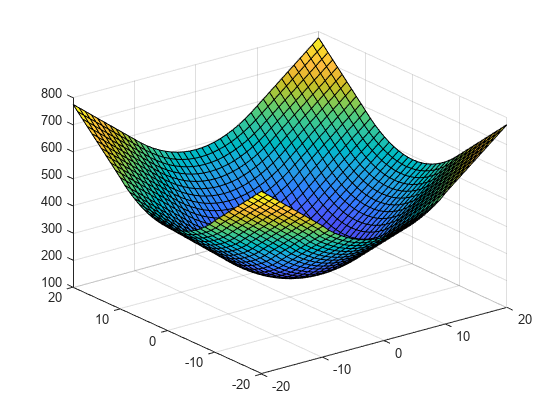
함수가 잘 샘플링되었기 때문에 좋은 외삽 결과가 반환되었습니다.