ns3
Measure normalized spectral similarity score
Description
Add-On Required: This feature requires the Hyperspectral Imaging Library for Image Processing Toolbox add-on.
score = ns3(inputData,refSpectrum)inputData and the specified reference spectrum
refSpectrum by using the normalized spectral similarity score (NS3)
method. Use this syntax to identify different regions or materials in a hyperspectral data
cube. For information about the NS3 method, see More About.
score = ns3(testSpectrum,refSpectrum)testSpectrum and reference spectrum refSpectrum
by using the NS3 method. Use this syntax to compare the spectral signature of an unknown
material against the reference spectrum or to compute spectral variability between two
spectral signatures.
Note
The Hyperspectral Imaging Library for Image Processing Toolbox™ requires desktop MATLAB®, as MATLAB Online™ and MATLAB Mobile™ do not support the library.
Examples
Read hyperspectral data into the workspace.
hcube = imhypercube("jasperRidge2_R198.hdr");Estimate the number of spectrally distinct endmembers in the data cube by using countEndmembersHFC function.
numEndmembers = countEndmembersHFC(hcube,PFA=10^-7);
Extract the endmember spectral signatures from the data cube by using the NFINDR algorithm.
endmembers = nfindr(hcube,numEndmembers);
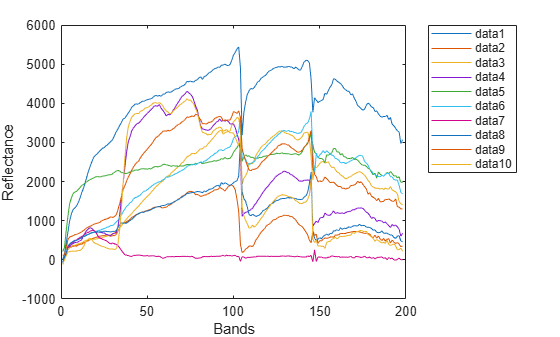
Plot the spectral signatures of the extracted endmembers.
figure
plot(endmembers)
xlabel("Bands")
ylabel("Reflectance")
legend(Location="Bestoutside")
Compute the NS3 distance between each endmember and the spectrum of each pixel in the data cube.
datacube = gather(hcube);
score = zeros(size(datacube,1),size(datacube,2),numEndmembers);
for i = 1:numEndmembers
    score(:,:,i) = ns3(hcube,endmembers(:,i));
end
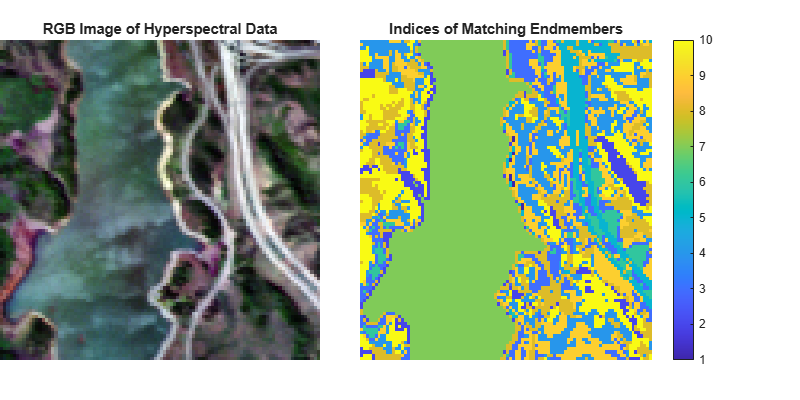
Compute the minimum score value from the distance scores obtained for each pixel spectrum with respect to all the endmembers. The index of each minimum score identifies the endmember spectrum to which a pixel spectrum exhibits maximum similarity. An index value, n, at the spatial location (x, y) in the score matrix indicates that the spectral signature of the pixel at spatial location (x, y) in the data cube best matches the spectral signature of the nth endmember.
[~,matchingIdx] = min(score,[],3);
Estimate an RGB image of the input data by using the colorize function.
rgbImg = colorize(hcube,Method="rgb",ContrastStretching=true);Display both the RGB image and the matrix of matched index values.
figure(Position=[0 0 800 400])
subplot(Position=[0 0.1 0.4 0.8])
imagesc(rgbImg)
axis off
title("RGB Image of Hyperspectral Data")
subplot('Position',[0.45 0.1 0.45 0.8])
imagesc(matchingIdx)
axis off
title("Indices of Matching Endmembers")
colorbar
Read hyperspectral data into the workspace.
hcube = imhypercube("jasperRidge2_R198.hdr");Find the first 10 endmembers of the hyperspectral data.
numEndmembers = 10;
endmembers = nfindr(hcube,numEndmembers);
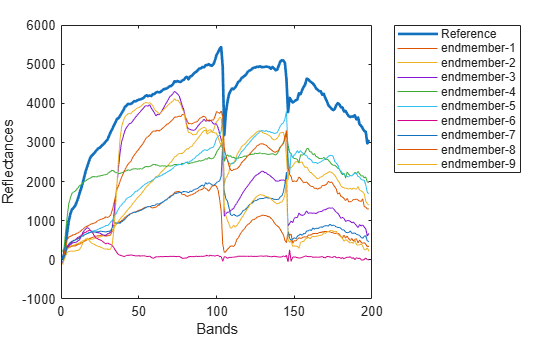
Consider the first endmember as the reference spectrum and the rest of the endmembers as the test spectrum.
refSpectrum = endmembers(:,1);
testSpectra = endmembers(:,2:end);
Plot the reference spectrum and other endmember spectra.
figure
plot(refSpectrum,LineWidth=2)
hold on
plot(testSpectra)
hold off
label(1) = "Reference";
for itr = 1:numEndmembers-1
    label(itr+1) = "endmember-"+num2str(itr);
end
xlabel("Bands")
ylabel("Reflectances")
legend(label,Location="Bestoutside")
Compute the NS3 score between the reference and test spectra.
score = zeros(1,numEndmembers-1);
for itr = 1:numEndmembers-1
    score(itr) = ns3(testSpectra(:,itr),refSpectrum);
end
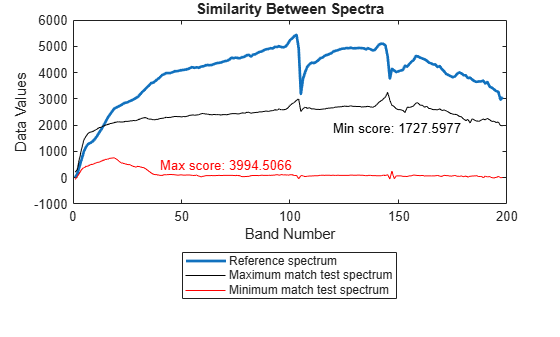
Find the test spectrum that exhibit maximum similarity (minimum distance) to the reference spectrum. Then, find the test spectrum that exhibit minimum similarity (maximum distance) to the reference spectrum.
[minval,minidx] = min(score);
maxMatch = testSpectra(:,minidx);
[maxval,maxidx] = max(score);
minMatch = testSpectra(:,maxidx);
Plot the reference spectrum, the maximum similarity, and the minimum similarity test spectrum. The test spectrum with the minimum score value indicates highest similarity to the reference endmember. On the other hand, the test spectrum with the maximum score value has the highest spectral variability.
figure
plot(refSpectrum,LineWidth=2)
hold on
plot(maxMatch,"k")
plot(minMatch,"r")
xlabel("Band Number")
ylabel("Data Values")
legend("Reference spectrum","Maximum match test spectrum","Minimum match test spectrum",...
       Location="Southoutside")
title("Similarity Between Spectra")
text(40,500,"Max score: "+num2str(maxval),Color="r")
text(120,1900,"Min score: "+num2str(minval),Color="k")
Input Arguments
Output Arguments
Limitations
This function does not
support parfor loops, as its performance is already
optimized. (since R2023a)
More About
References
[1] Nidamanuri, Rama Rao, and Bernd Zbell. “Normalized Spectral Similarity Score (NS3) as an Efficient Spectral Library Searching Method for Hyperspectral Image Classification.” IEEE Journal of Selected Topics in Applied Earth Observations and Remote Sensing 4, no. 1 (March 2011): 226–40. https://doi.org/10.1109/JSTARS.2010.2086435.
Version History
Introduced in R2020b
See Also
spectralMatch | readEcostressSig | sid | hypercube | jmsam | sidsam | sam