sam
Measure spectral similarity using spectral angle mapper
Description
Add-On Required: This feature requires the Hyperspectral Imaging Library for Image Processing Toolbox add-on.
score = sam(inputData,refSpectra)inputData and the specified reference spectra
refSpectra by using the spectral angle mapper (SAM) classification
algorithm. Use this syntax to identify different regions or materials in a hyperspectral
data cube.
score = sam(testSpectra,refSpectra)testSpectra and reference spectra refSpectra by
using the SAM classification algorithm. Use this syntax to compare the spectral signature of
an unknown material against the reference spectra or to compute spectral variability between
two spectral signatures.
Note
The Hyperspectral Imaging Library for Image Processing Toolbox™ requires desktop MATLAB®, as MATLAB Online™ and MATLAB Mobile™ do not support the library.
Examples
Distinguish different regions in a hyperspectral data cube by computing the spectral angle distance between each pixel and the endmember spectra of the data cube.
Read hyperspectral data into the workspace.
hcube = imhypercube("jasperRidge2_R198.hdr");Identify the number of spectrally distinct bands in the data cube by using the countEndmembersHFC function.
numEndmembers = countEndmembersHFC(hcube)
numEndmembers =
13
Extract the endmember spectral signatures from the data cube by using the NFINDR algorithm.
endmembers = nfindr(hcube,numEndmembers);
Plot the spectral signatures of the endmembers. The result shows the 14 spectrally distinct regions in the data cube.
figure
plot(endmembers)
legend(Location="Bestoutside")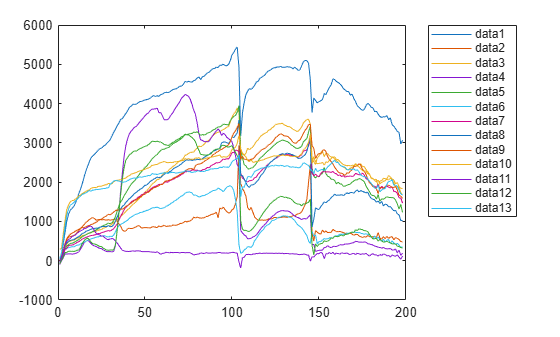
Compute the spectral angular distance between each endmember and the spectrum of each pixel in the data cube.
datacube = gather(hcube);
score = zeros(size(datacube,1),size(datacube,2),numEndmembers);
for i = 1:numEndmembers
    score(:,:,i) = sam(hcube,endmembers(:,i));
end
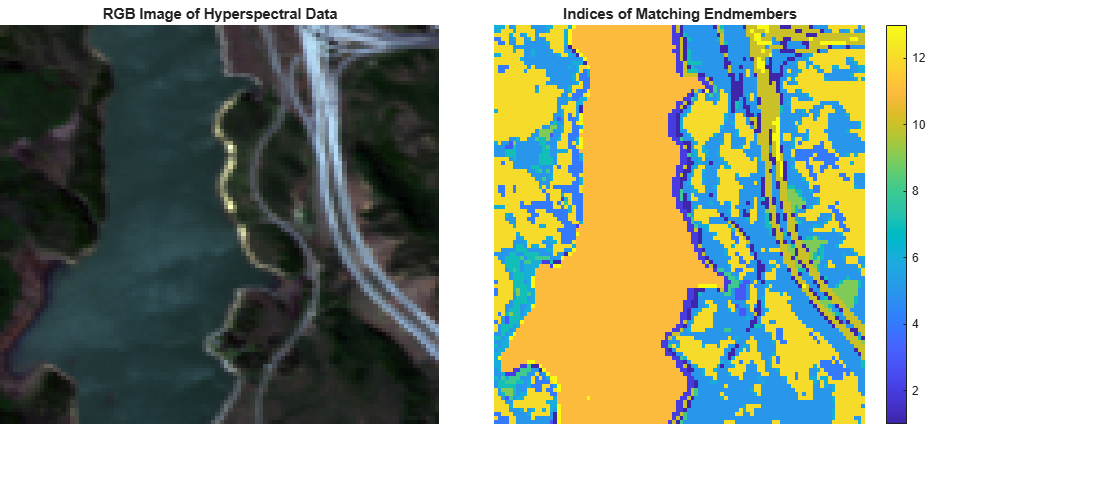
Compute the minimum score value from the distance scores obtained for each pixel spectrum with respect to all the endmembers. The index of each minimum score identifies the endmember spectrum to which a pixel spectrum exhibits maximum similarity. An index value, n, at the spatial location (x, y) in the score matrix indicates that the spectral signature of the pixel at spatial location (x, y) in the data cube best matches the spectral signature of the nth endmember.
[~,matchingIndx] = min(score,[],3);
Estimate an RGB image of the hyperspectral data cube by using the colorize function. Display both the RGB image and the matrix of matched index values.
rgbImg = colorize(hcube,Method="rgb");
figure(Position=[0 0 1100 500])
subplot(Position=[0 0.15 0.4 0.8])
imagesc(rgbImg)
axis off
title("RGB Image of Hyperspectral Data")
subplot(Position=[0.45 0.15 0.4 0.8])
imagesc(matchingIndx)
axis off
title("Indices of Matching Endmembers")
colorbar
Read hyperspectral data into the workspace.
hcube = imhypercube("indian_pines.dat");Find ten endmembers of the hyperspectral data.
numEndmembers = 10;
endmembers = nfindr(hcube,numEndmembers);
Consider the first endmember as the reference spectrum and the rest of the endmembers as the test spectrum. Compute the SAM score between the reference and test spectrum.
score = zeros(1,numEndmembers-1);
refSpectrum = endmembers(:,1);
for i = 2:numEndmembers
    testSpectrum = endmembers(:,i);
    score(i-1) = sam(testSpectrum,refSpectrum);
end
Find the test spectrum that exhibit maximum similarity (minimum distance) to the reference spectrum. Then find the test spectrum that exhibit minimum similarity (maximum distance) to the reference spectrum.
[minval,minidx] = min(score);
maxMatch = endmembers(:,minidx);
[maxval,maxidx] = max(score);
minMatch = endmembers(:,maxidx);
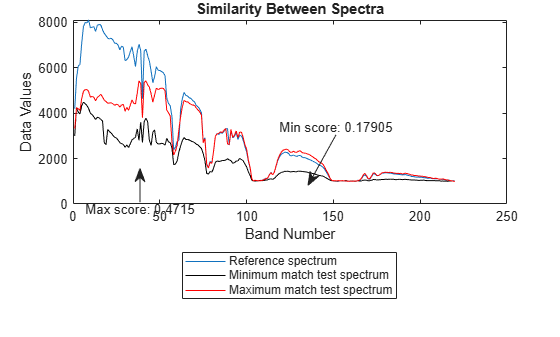
Plot the reference spectrum, the maximum similarity and the minimum similarity test spectrum. The test spectrum with the minimum score value indicates highest similarity to the reference endmember. On the other hand, the test spectrum with the maximum score value has the highest spectral variability and characterizes the spectral behavior of two different materials.
figure
plot(refSpectrum)
hold on
plot(maxMatch,"k")
plot(minMatch,"r")
xlabel("Band Number")
ylabel("Data Values")
legend("Reference spectrum","Minimum match test spectrum","Maximum match test spectrum", ...
       Location="southoutside")
title("Similarity Between Spectra")
annotation("textarrow",[0.25 0.25],[0.4 0.5],String="Max score: "+maxval)
annotation("textarrow",[0.6 0.55],[0.6 0.45],String="Min score: "+minval)
Input Arguments
Output Arguments
Limitations
This function does not
support parfor loops, as its performance is already
optimized. (since R2023a)
More About
References
[1] Kruse, F.A., A.B. Lefkoff, J.W. Boardman, K.B. Heidebrecht, A.T. Shapiro, P.J. Barloon, and A.F.H. Goetz. “The Spectral Image Processing System (SIPS)—Interactive Visualization and Analysis of Imaging Spectrometer Data.” Remote Sensing of Environment 44, no. 2–3 (May 1993): 145–63. https://doi.org/10.1016/0034-4257(93)90013-N.
Version History
Introduced in R2020a
See Also
spectralMatch | readEcostressSig | sid | hypercube | sidsam | jmsam