이 번역 페이지는 최신 내용을 담고 있지 않습니다. 최신 내용을 영문으로 보려면 여기를 클릭하십시오.
bodeplot
추가 플롯 사용자 지정 옵션을 사용한 보드 주파수 응답 플로팅
구문
h = bodeplot(sys)

bodeplot(sys)

bodeplot(sys1,sys2,...)

bodeplot(AX,...)

bodeplot(..., plotoptions)

bodeplot(sys,w)
설명
h = bodeplot(sys)는 동적 시스템 모델 sys의 보드 크기 및 위상을 플로팅하고 플롯에 대한 플롯 핸들 h를 반환합니다. getoptions 명령과 setoptions 명령에서 이 핸들을 사용하여 플롯을 사용자 지정할 수 있습니다.
bodeplot(sys)는 모델 sys의 보드 플롯을 그립니다. 주파수 범위와 점 개수는 자동으로 선택됩니다.
bodeplot(sys1,sys2,...)는 여러 모델 sys1,sys2,...의 보드 응답을 단일 플롯에 표시합니다. 다음과 같이 각 모델에 대해 색, 선 스타일 및 마커를 지정할 수 있습니다.
bodeplot(sys1,'r',sys2,'y--',sys3,'gx')
bodeplot(AX,...)는 핸들 AX를 사용하여 좌표축에 플로팅합니다.
bodeplot(..., plotoptions)는 plotoptions에 지정된 옵션을 사용하여 보드 응답을 플로팅합니다. 다음을 입력하면
help bodeoptions
사용 가능한 플롯 옵션을 볼 수 있습니다. PhaseMatchingFreq 및 PhaseMatchingValue 옵션을 사용한 위상 정합 예제는 지정된 주파수에서 위상 일치시키기 항목을 참조하십시오.
bodeplot(sys,w)는 w로 지정된 주파수에 대해 보드 플롯을 그립니다. w = {wmin,wmax}인 경우 wmin과 wmax(단위 :rad/TimeUnit, 여기서 TimeUnit은 입력 동적 시스템의 시간 단위로, sys의 TimeUnit 속성에 지정됨) 사이의 주파수에 대해 보드 플롯이 그려집니다. w가 사용자가 입력한 주파수로 구성된 w인 경우(단위: rad/TimeUnit) 지정된 주파수에 대해 보드 응답이 그려집니다.
로그 간격의 주파수 벡터를 생성하려면 logspace를 참조하십시오.
예제
보드 플롯을 생성합니다.
sys = rss(5);
h = bodeplot(sys);

단위를 Hz로 변경하고 위상 플롯을 표시하지 않습니다. 이를 위해 플롯 핸들 h의 속성을 편집합니다.
setoptions(h,'FreqUnits','Hz','PhaseVisible','off');

setoptions를 호출하면 플롯이 자동으로 업데이트됩니다.
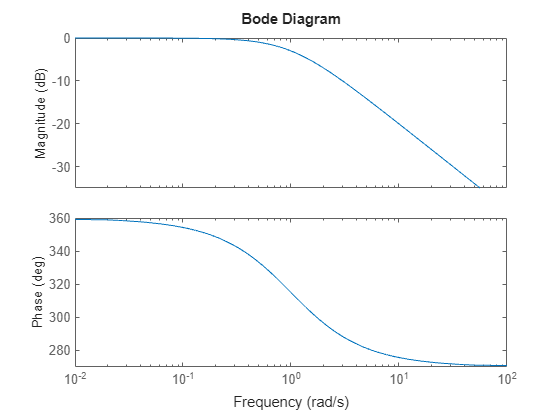
동적 시스템의 보드 플롯을 만듭니다.
sys = tf(1,[1 1]);
h = bodeplot(sys);

1rad/s에서의 위상을 750도로 고정합니다. 이를 위해 플롯 속성을 가져옵니다. 그런 다음 지정된 주파수에 위상이 일치하도록 속성 PhaseMatchingFreq와 PhaseMatchingValue를 변경합니다.
p = getoptions(h);
p.PhaseMatching = 'on';
p.PhaseMatchingFreq = 1;
p.PhaseMatchingValue = 750;
플롯을 업데이트합니다.
setoptions(h,p);
첫 번째 보드 플롯은 주파수 1rad/s에서 위상 -45도를 갖습니다. 1rad/s에서 위상이 750도 가까이 되도록 위상 정합 옵션을 설정하면 두 번째 보드 플롯이 생성됩니다. 단, 위상은 -45 + N*360만 될 수 있습니다(이때 N은 정수). 따라서 플롯은 허용되는 가장 가까운 위상, 즉 675도(2*360 - 45 = 675)로 설정됩니다.
2차 및 6차 식별된 상태공간 모델의 주파수 응답을 2 신뢰영역과 함께 비교합니다.
load iddata1
sys1 = n4sid(z1, 2);
sys2 = n4sid(z1, 6);
두 모델 모두 데이터에 대해 약 70%의 적합성을 가집니다. 그러나 sys2는 플롯에서 볼 수 있듯이 특히 나이퀴스트 주파수 근처에서 주파수 응답의 불확실성이 높아집니다.
w = linspace(8,10*pi,256);
h = bodeplot(sys1,sys2,w);
setoptions(h,'PhaseMatching','on','ConfidenceRegionNumberSD',2);

플롯을 마우스 오른쪽 버튼으로 클릭하고 특성 > 신뢰영역을 선택하여 신뢰영역 특성을 켭니다. 또는 showConfidence(h)를 입력하여 신뢰영역을 플로팅합니다.
입력/출력 데이터에서 식별된 모수적 모델의 주파수 응답을 동일한 데이터를 사용하여 식별된 비모수적 모델의 주파수 응답과 비교합니다. 데이터를 기반으로 모수적 모델과 비모수적 모델을 식별합니다.
load iddata2 z2;
w = linspace(0,10*pi,128);
sys_np = spa(z2,[],w);
sys_p = tfest(z2,2);
spa와 tfest를 사용하려면 System Identification Toolbox™가 필요합니다. sys_np는 식별된 비모수적 모델입니다. sys_p는 식별된 모수적 모델입니다.
두 시스템을 포함하는 보드 플롯을 만듭니다.
opt = bodeoptions;
opt.PhaseMatching = 'on';
bodeplot(sys_np,sys_p,w,opt);
팁
한 예로 단위 같은 플롯의 속성을 변경할 수 있습니다. 플롯의 속성을 변경하는 방법에 대한 자세한 내용은 항목을 참조하십시오.
버전 내역
R2006a 이전에 개발됨
참고 항목
bode | bodeoptions | getoptions | setoptions | showConfidence