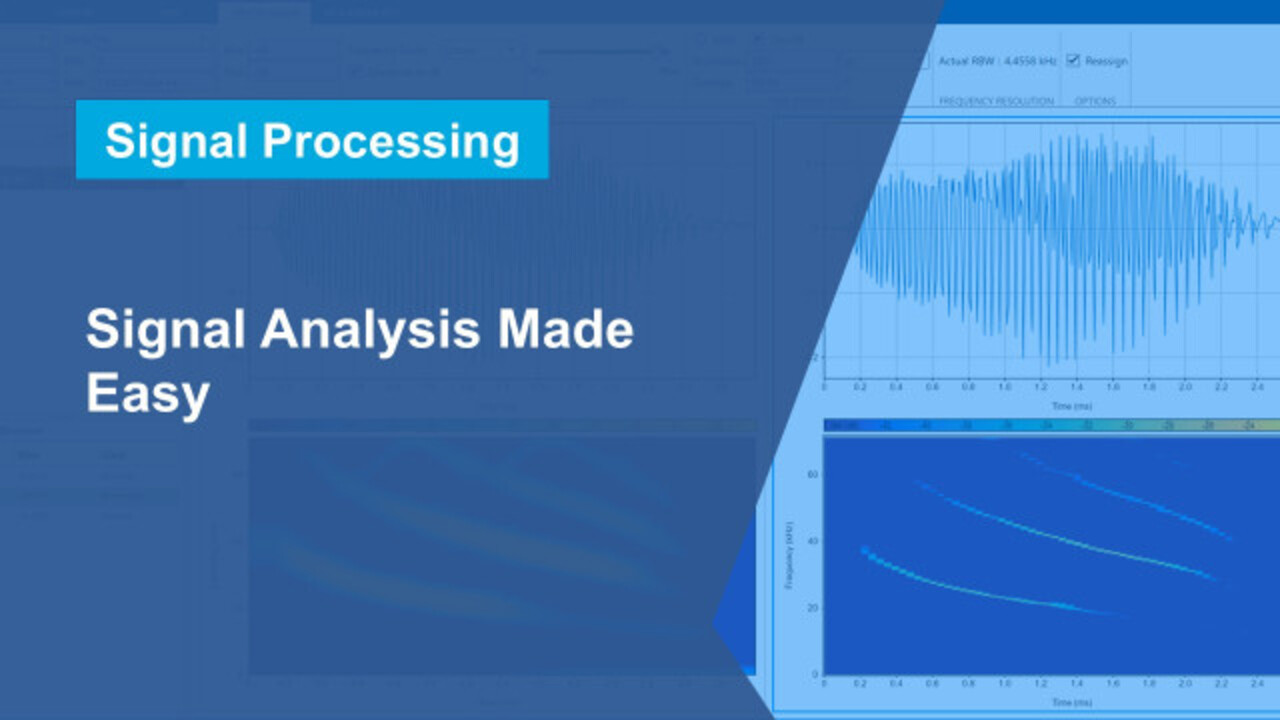
Signal Analysis Made Easy with the Signal Analyzer App
Learn how to perform signal analysis tasks in MATLAB® with the Signal Analyzer app. You can perform signal analysis techniques such as visualizing and preprocessing the signal; and filtering, identifying, and measuring relevant features without writing any code.
See how the Signal Analyzer app can also help you:
- Import and visualize signal data
- Preprocess and filter signals to enhance the quality of the signal
- Visualize the signal in time domain and frequency domains
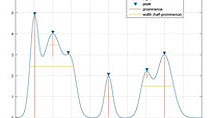
- Analyze and measure trends, peaks, and other characteristic features of the signal
Published: 3 Nov 2020
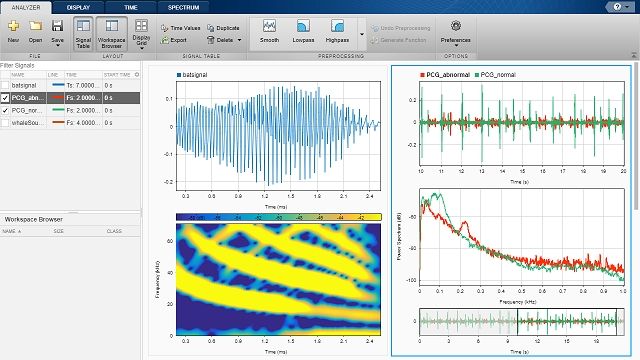
The Signal Analyzer App in the Signal Processing toolbox lets you visualize, analyze, and compare signals in the time, frequency and time-frequency domains without needing to write any code.
You can explore signals and identify and extract key features. You can also easily apply various preprocessing techniques to the signals in the app. The app provides a way to work with many signals at the same time and in the same view.
The Signal Analyzer app can be launched from the MATLAB command line, or from the apps gallery. All supported signals in the MATLAB workspace are available in the workspace browser here. The app accepts MATLAB variables including timetables and complex signals. You can drag the signal you are interested in, into the display to visualize it.
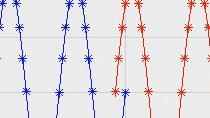
You can add time information and sample rate for the signal or bring in signals as timetable which has inherent time information. The signal can then be explored in the time domain. You can use the spectrum and time-frequency views to analyze the signal in different domains. Using the panner option, in the display tab you can zoom into and navigate to specific regions of the signal.
When the panner is activated and zoomed in on a particular region, you can look at the windowed region in all views simultaneously. As you explore and inspect your signals, if you find regions that you want to analyze separately, the ‘Extract Signals’ option enables you to extract these regions and save them as separate signals. You can measure signal values using the data cursors.
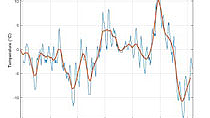
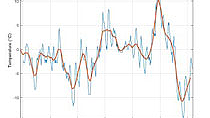
If you want to perform preprocessing on a signal, the app provides built-in functions to perform filtering, detrending, and resampling. You can also compute signal envelopes and smooth signals using moving averages, regression, Savitzky-Golay filters, or other methods. The app also allows you to bring in custom preprocessing functions for your signals.
For this signal, we will apply a low pass filter to extract low frequency components. Finding the best preprocessing technique can be a trial and error process, and the app allows you to create duplicate signals to preserve the original before performing preprocessing. You can also revert the preprocessing if required.
The app provides other advanced spectral analysis techniques as well. If you are analyzing signals, which may have transients or hidden components such as this broadband signal which has narrowband interference, the power spectrum may not be helpful to detect the interference. Here you can use the persistence spectrum to find the interference. The persistence spectrum is a histogram in power-frequency space.
There are many options for the time-frequency view as well. You can set values for different parameters and apply reassignment to a spectrogram when required, which sharpens the spectrogram and makes it easier to interpret.
If you have the wavelet toolbox, you can use the scalogram which is a representation of the wavelet transform and can be used to identify signals with low-frequency components and to analyze signals whose frequency content changes rapidly with time, such as this hyperbolic chirp signal.
Once you have completed analyzing the signals, you can export the modified signals from the app into the MATLAB workspace. The app also provides the option to generate MATLAB code for preprocessing and analysis tasks performed in the app. Here, we will generate MATLAB code for the scalogram. This enable you to easily integrate the code into your signal processing applications and allows your colleagues to replicate your results. You can also save an entire session in the Signal Analyzer if you want to continue working on it later.
If you need help with the app, navigate to the documentation using the Help button on the top right to find all the information you need about Signal Analyzer. You can find many examples for Signal Analyzer App here.
Related Products
Learn More


웹사이트 선택
번역된 콘텐츠를 보고 지역별 이벤트와 혜택을 살펴보려면 웹사이트를 선택하십시오. 현재 계신 지역에 따라 다음 웹사이트를 권장합니다: United States
또한 다음 목록에서 웹사이트를 선택하실 수도 있습니다.
미주
- América Latina (Español)
- Canada (English)
- United States (English)
유럽
- Belgium (English)
- Denmark (English)
- Deutschland (Deutsch)
- España (Español)
- Finland (English)
- France (Français)
- Ireland (English)
- Italia (Italiano)
- Luxembourg (English)
- Netherlands (English)
- Norway (English)
- Österreich (Deutsch)
- Portugal (English)
- Sweden (English)
- Switzerland
- United Kingdom (English)