주요 콘텐츠
다음에 대한 결과:
Do you boast about the energy savings you racking up by using dark mode while stashing your energy bill savings away for an exotic vacation🌴🥥? Well, hold onto your sun hats and flipflops!
A recent study presented at the 1st Internaltional Workshop on Low Carbon Computing suggests that you may be burning more ⚡energy⚡ with your slick dark displays 💻[1].
In a 2x2 factorial design, ten participants viewed a webpage in dark and light modes in both dim and lit settings using an LCD monitor with 16 brightness levels.
- 80% of participants increased the monitor's brightness in dark mode [2]
- This occurred in both lit and dim rooms
- Dark mode did not reduce power draw but increasing monitor brightness did.
The color pixels in an LCD monitor still draw voltage when the screen is black, which is why the monitor looks gray when displaying a pure black background in a dark room. OLED monitors, on the other hand, are capable of turning off pixels that represent pure black and therefore have the potential to save energy with dark mode. A 2021 Purdue study estimates a 3%-9% energy savings with dark mode on OLED monitors using auto-brightness [3]. However, outside of gaming, OLED monitors have a very small market share and still account for less than 25% within the gaming world.
Any MATLAB users out there with OLED monitors? How are you going to spend your mad cash savings when you start using MATLAB's upcoming dark theme?
- BBC study: https://www.sicsa.ac.uk/wp-content/uploads/2024/11/LOCO2024_paper_12.pdf
- BBC blog article https://www.bbc.co.uk/rd/articles/2025-01-sustainability-web-energy-consumption
- 2021 Purdue https://dl.acm.org/doi/abs/10.1145/3458864.3467682
Three former MathWorks employees, Steve Wilcockson, David Bergstein, and Gareth Thomas, joined the ArrayCast pod cast to discuss their work on array based languages. At the end of the episode, Steve says,
> It's a little known fact about MATLAB. There's this thing, Gareth has talked about the community. One of the things MATLAB did very, very early was built the MATLAB community, the so-called MATLAB File Exchange, which came about in the early 2000s. And it was where people would share code sets, M files, et cetera. This was long before GitHub came around. This was well ahead of its time. And I think there are other places too, where MATLAB has delivered cultural benefits over and above the kind of core programming and mathematical capabilities too. So, you know, MATLAB Central, File Exchange, very much saw the future.
Listen here: The ArrayCast, Episode 79, May 10, 2024.
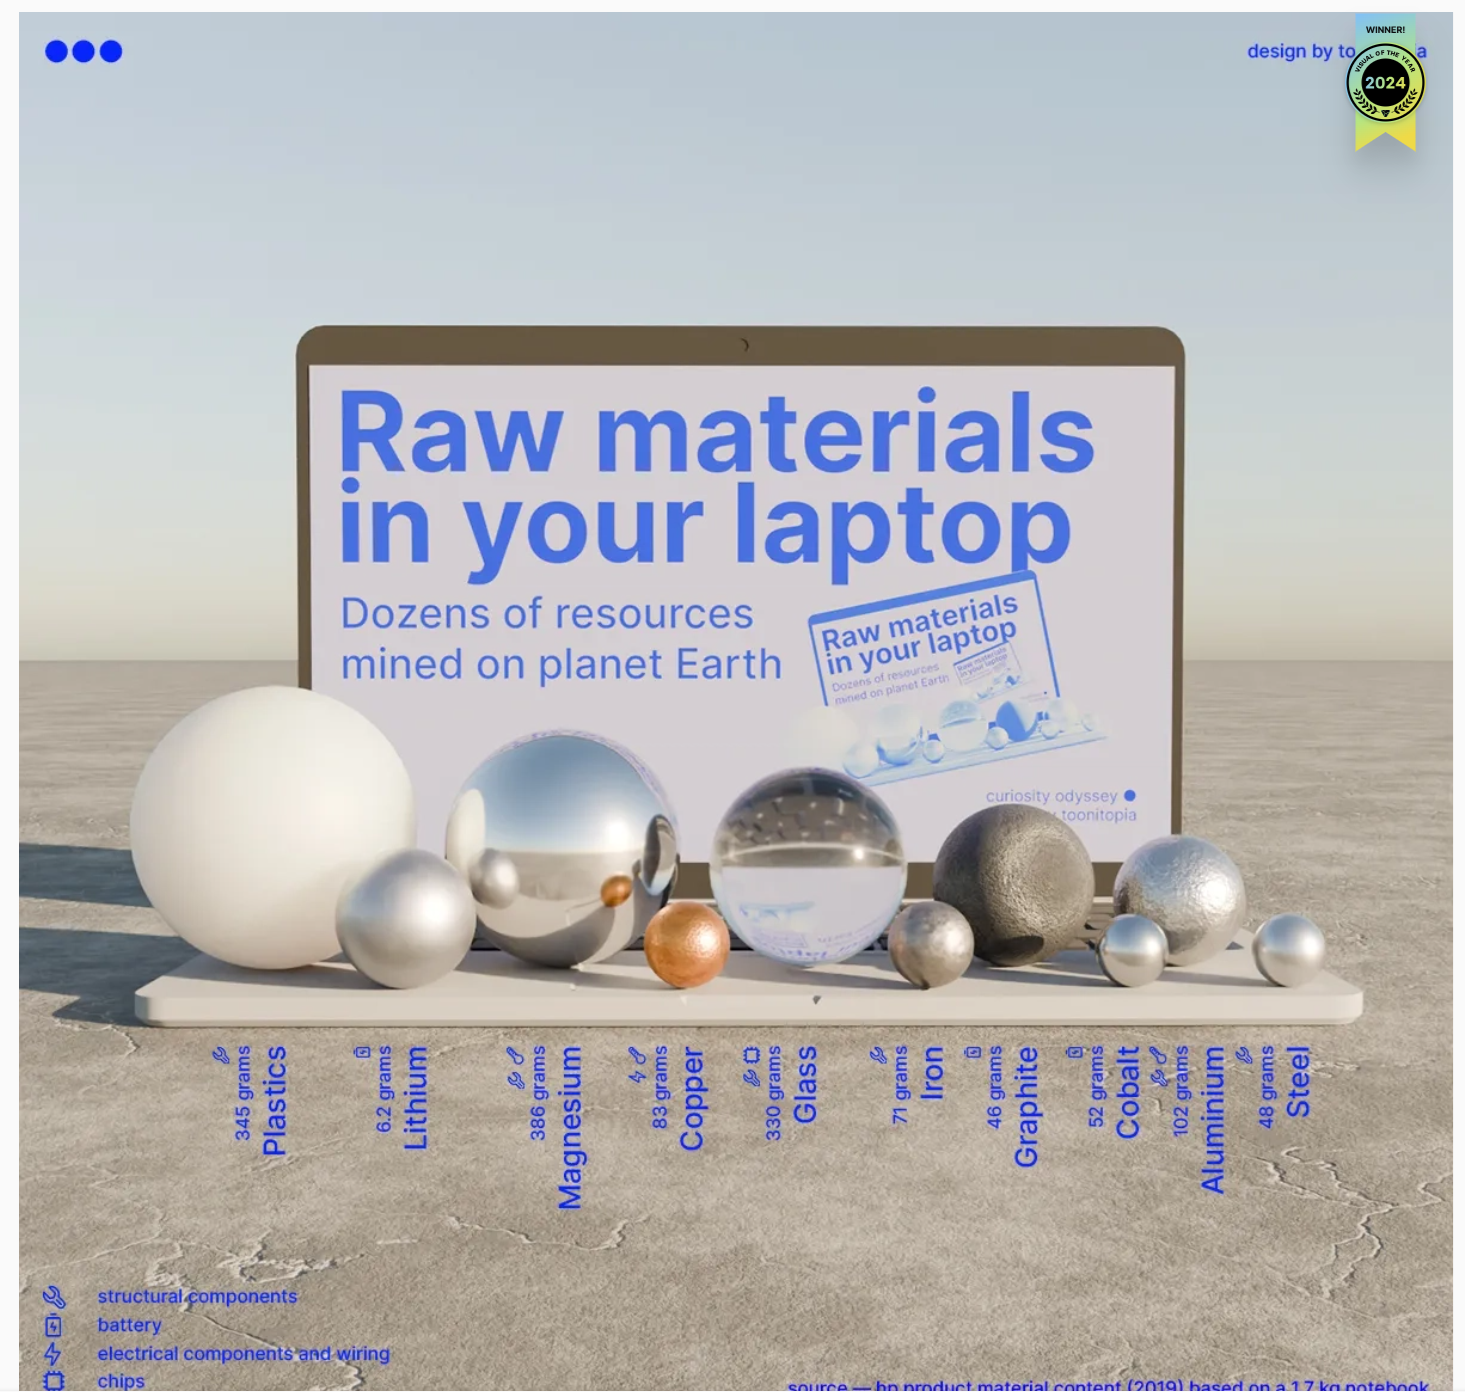
Check out this 3D chart that won Visual Of The Year for 2024 by Visual Capitalist. It's a mashup between a 3D bubblechart and a categorical bar plot yet the only graphical components are the x-axis labels and the legend. Not only does it show relative proportions of material in a laptop but it also shows what the raw material looks like.
I love the idea of analog data visualization. I wonder if any readers have made a analog "chart".
Are you a Simulink user eager to learn how to create apps with App Designer? Or an App Designer enthusiast looking to dive into Simulink?
Don't miss today's article on the Graphics and App Building Blog by @Robert Philbrick! Discover how to build Simulink Apps with App Designer, streamlining control of your simulations!
Over the weekend I came across a pi approximation using durations of years and weeks (image below, Wolfram, eq. 89), accurate to 6 digits using the average Gregorian year (365.2425 days).
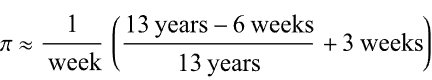
Here it is in MATLAB. I divided by 1 week at the end rather than multiplying by its reciprocal because you can’t divide a numeric by a duration in MATLAB (1/week).
weeks = @(n)n*days(7);
piApprox = ((years(13)-weeks(6))/years(13) + weeks(3)) / weeks(1)
% piApprox = 3.141593493469302
Here’s a breakdown
- The first argument becomes 12.885 yrs / 13 yrs or 0.99115
- Add three weeks: 0.99115 + 3 weeks = 21.991 days
- The reduced fraction becomes 21.991 days / 7 days
Now it looks a lot closer to the more familiar approximation for pi 22/7 but with greater precision!
I'm curious how the community uses the hold command when creating charts and graphics in MATLAB. In short, hold on sets up the axes to add new objects to the axes while hold off sets up the axes to reset when new objects are added.
When you use hold on do you always follow up with hold off? What's your reasoning on this decision?
Can't wait to discuss this here! I'd love to hear from newbies and experts alike!
또한 다음 목록에서 웹사이트를 선택하실 수도 있습니다.
미주
- América Latina (Español)
- Canada (English)
- United States (English)
유럽
- Belgium (English)
- Denmark (English)
- Deutschland (Deutsch)
- España (Español)
- Finland (English)
- France (Français)
- Ireland (English)
- Italia (Italiano)
- Luxembourg (English)
- Netherlands (English)
- Norway (English)
- Österreich (Deutsch)
- Portugal (English)
- Sweden (English)
- Switzerland
- United Kingdom(English)
아시아 태평양
- Australia (English)
- India (English)
- New Zealand (English)
- 中国
- 日本Japanese (日本語)
- 한국Korean (한국어)