LDA 토픽 상관 시각화하기
이 예제에서는 LDA(잠재 디리클레 할당) 토픽 모델에서 토픽 사이의 상관을 분석하는 방법을 보여줍니다.
LDA 모델은 문서 모음에서 기저 토픽을 발견하고 토픽 내 단어 확률을 추정하는 토픽 모델입니다. 토픽별 단어 확률로 구성된 벡터는 토픽의 특성을 나타냅니다. 토픽별 단어 확률을 사용하여 토픽 간의 상관을 식별할 수 있습니다.
LDA 모델 불러오기
다양한 고장 이벤트를 자세히 설명하는 공장 보고서 데이터 세트를 사용하여 훈련된 LDA 모델 factoryReportsLDAModel을 불러옵니다. LDA 모델을 텍스트 데이터 모음에 피팅하는 방법을 보여주는 예제는 토픽 모델을 사용하여 텍스트 데이터 분석하기 항목을 참조하십시오.
load factoryReportsLDAModel
mdl
mdl =
ldaModel with properties:
NumTopics: 7
WordConcentration: 1
TopicConcentration: 0.5755
CorpusTopicProbabilities: [0.1587 0.1573 0.1551 0.1534 0.1340 0.1322 0.1093]
DocumentTopicProbabilities: [480×7 double]
TopicWordProbabilities: [158×7 double]
Vocabulary: ["item" "occasionally" "get" "stuck" "scanner" "spool" "loud" "rattling" "sound" "come" "assembler" "piston" "cut" "power" "start" "plant" "capacitor" "mixer" … ]
TopicOrder: 'initial-fit-probability'
FitInfo: [1×1 struct]
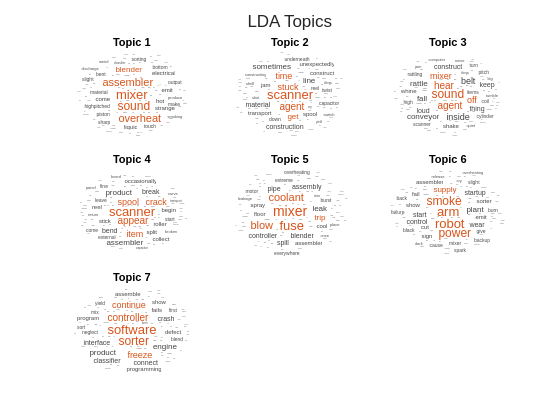
워드 클라우드를 사용하여 토픽을 시각화합니다.
numTopics = mdl.NumTopics;

figure
t = tiledlayout("flow");
title(t,"LDA Topics")

for i = 1:numTopics
    nexttile
    wordcloud(mdl,i);
    title("Topic " + i)
end
토픽 상관 시각화하기
corrcoef 함수에 LDA 모델 토픽 단어 확률을 입력값으로 사용하여 토픽 사이의 상관을 계산합니다.
correlation = corrcoef(mdl.TopicWordProbabilities);
상관을 히트맵으로 표시하고 각 토픽의 레이블을 상위 3개 단어로 지정합니다. 히트맵에서 각 토픽과 자신과의 자명한 상관관계가 나타나지 않도록 하기 위해 상관에서 단위 행렬을 뺍니다.
각 토픽에 대해 상위 3개 단어를 찾습니다.
numTopics = mdl.NumTopics;
for i = 1:numTopics
    top = topkwords(mdl,3,i);
    topWords(i) = join(top.Word,", ");
end
heatmap 함수를 사용하여 상관을 플로팅합니다.
figure
heatmap(correlation - eye(numTopics), ...
    XDisplayLabels=topWords, ...
    YDisplayLabels=topWords)

title("LDA Topic Correlations")
xlabel("Topic")
ylabel("Topic")

각 토픽에 대해 상관관계가 가장 강한 토픽을 찾고 그 쌍을 해당 상관 계수와 함께 테이블에 표시합니다.
[topCorrelations,topCorrelatedTopics] = max(correlation - eye(numTopics));

tbl = table;
tbl.TopicIndex = (1:numTopics)';
tbl.Topic = topWords';
tbl.TopCorrelatedTopicIndex = topCorrelatedTopics';
tbl.TopCorrelatedTopic = topWords(topCorrelatedTopics)';
tbl.CorrelationCoefficient = topCorrelations'
tbl=7×5 table
    1         "mixer, sound, assembler"    5            "mixer, fuse, coolant"    0.3430
    2           "scanner, agent, stuck"    4          "scanner, appear, spool"    0.3453
    3              "sound, agent, hear"    1         "mixer, sound, assembler"    0.2691
    4          "scanner, appear, spool"    2           "scanner, agent, stuck"    0.3453
    5            "mixer, fuse, coolant"    1         "mixer, sound, assembler"    0.3430
    6               "arm, robot, smoke"    1         "mixer, sound, assembler"    0.0042
    7    "software, sorter, controller"    7    "software, sorter, controller"         0
참고 항목
tokenizedDocument | fitlda | ldaModel | wordcloud