Profiling and Optimization
Profile the task execution time and function execution time of the real-time application that is running on the target computer. Then, you can tune its performance.
Objects
Target | Represent real-time application and target computer status |
Instrument | Create real-time instrument object |
slrealtime.instrument.LineStyle | Create real-time instrument LineStyle object (Since R2022b) |
ProfilerData | Data returned from profiler |
Stimulation | Target computer model root inport stimulator object (Since R2021a) |
Functions
startProfiler | Start profiling service on target computer |
stopProfiler | Stop profiling service on target computer |
getProfilerData | Retrieve profile data object |
resetProfiler | Reset profiling service state to Ready
|
slrtTETMonitor | Open Simulink Real-Time task execution time (TET) monitor |
plot | Generate execution profiler plot |
report | Generate profiler report |
getSupportInfo | Creates slrealtimeinfo.txt file that provides support information
about Simulink
Real-Time installation |
getCrashStack | Downloads and decodes crash stack core files from target computer and opens these in MATLAB editor |
Blocks
| Enable Profiler | Start and stop execution profiler on target computer |
| Log Event | Log an execution profiling event |
Topics
- Execution Modes for Real-Time Applications
Learn about the behavior of the interrupt and polling execution modes.
- Simulink Real-Time Options Pane
Configure initial values for real-time application options.
Related Information
Featured Examples
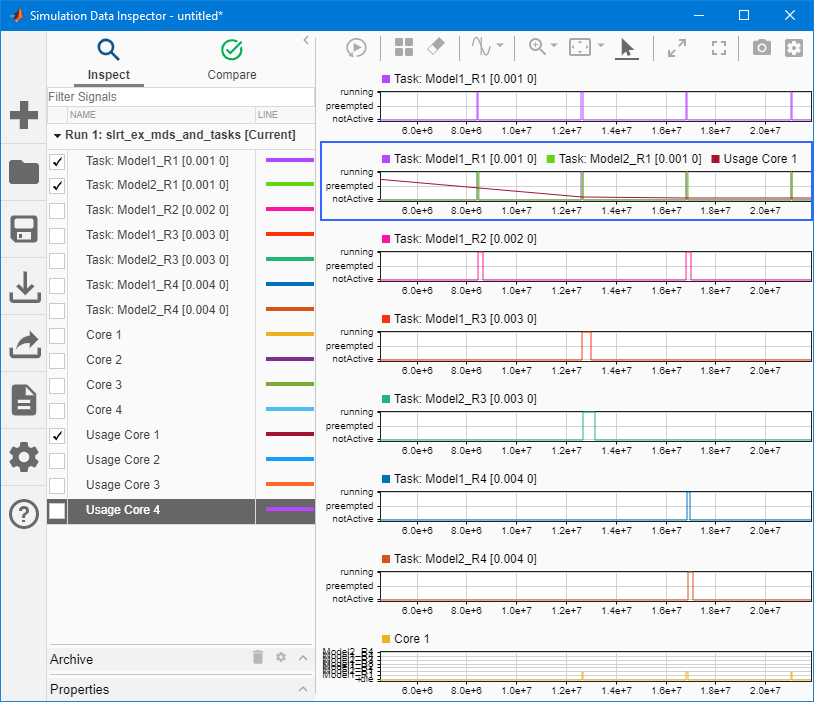
Concurrent Execution on Simulink Real-Time
Apply explicit partitioning to enhance concurrent execution of a real-time application that you generate by using Simulink Real-Time.
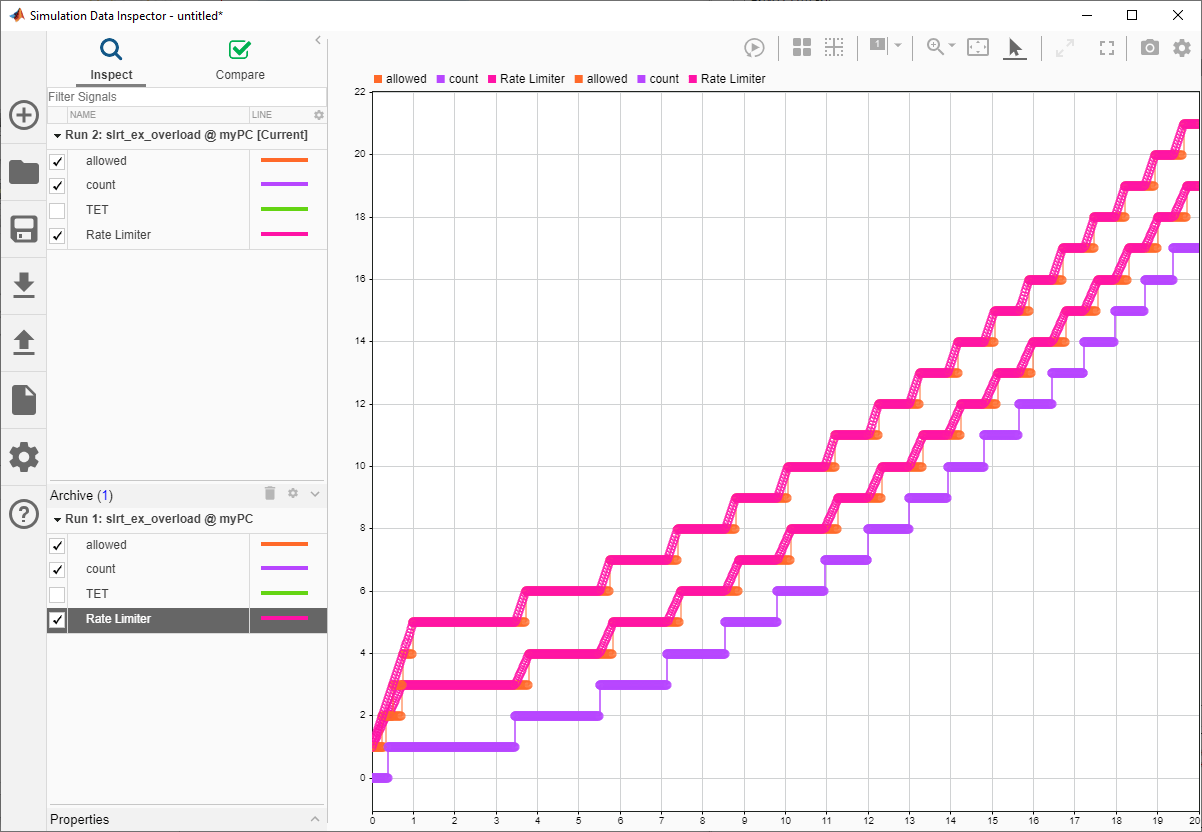
Monitor CPU Overload Rate
Design a model that uses the SLRT Overload Options block to monitor the rate at which CPU overloads occur.
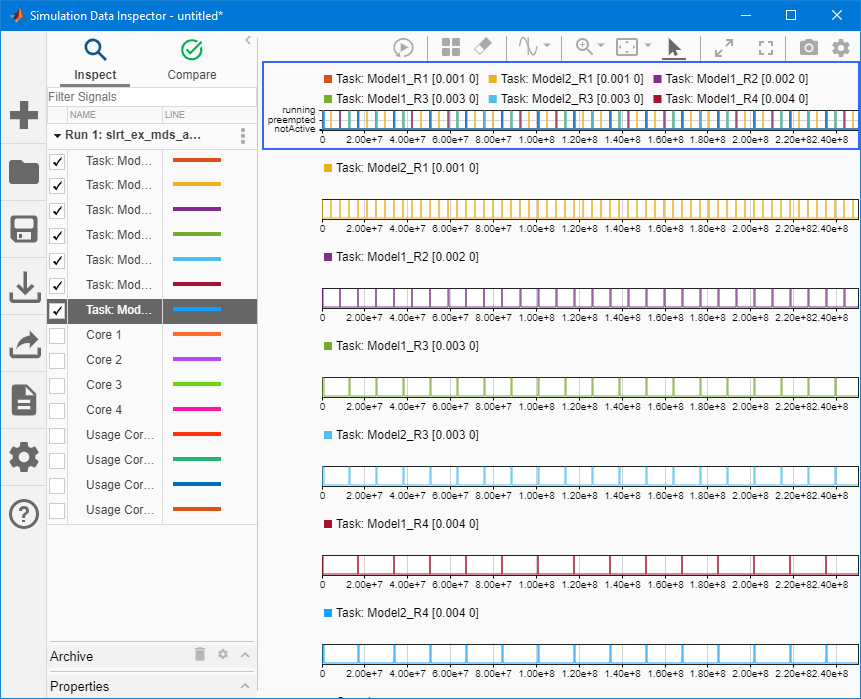
Execution Profiling for Real-Time Applications
Profile the task execution time and function execution time of your real-time application running on the target computer.
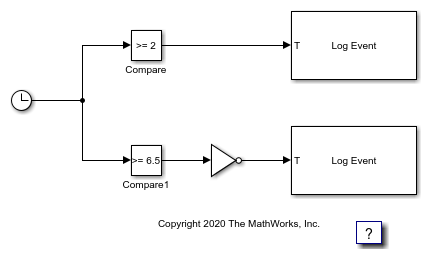
Insert Event into Execution Profiling Stream
Use the Log Event block to insert a user-defined event into the execution profiling event stream.