slrtTETMonitor
Open Simulink Real-Time task execution time (TET) monitor
Syntax
Description
slrtTETMonitor opens the Simulink®
Real-Time™ task execution time (TET) monitor in the MATLAB session that is
available for all Simulink Real-Time
target objects. You can
open the TET monitor at any time. Depending on the current state of connected
target computers, the
monitor displays TET data for each real-time
application task. Changes
to the target computer
state are updated in the TET monitor. The monitor displays these target states:
target_nameWaiting for real-time execution to start: Displays name of target computer connected to Simulink Real-Time. Displays no TET data is because no real-time application is loaded or executing.target_nameBaseRaterate_value: Displays TET data for execution of the real-time because a real-time application is executing.
Examples
In the Post-Process Real-time Signals Streamed to the Simulation Data Inspector example, use these additional steps to display the TET monitor.
Open the
slrt_ex_oscmodel.mdlName = 'slrt_ex_osc'; openExample(mdlName);Build the real-time application, load it on the target computer, and start the application. In Simulink Editor Real-Time tab, click Run on Target.
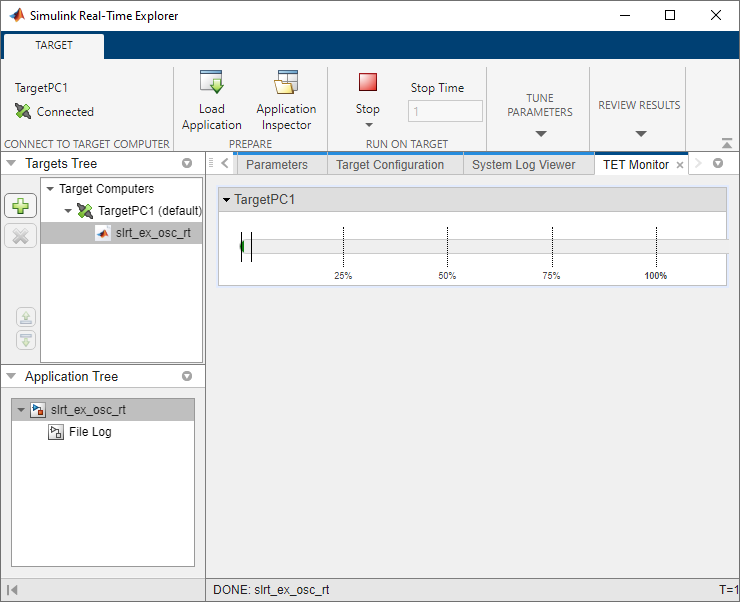
Open the TET monitor. In the Real-Time tab, click TET Monitor. Or, in the Command Window, enter:
slrtTETMonitor
When you run the real-time application, the TET monitor displays status.
In the Post-Process Real-time Signals Streamed to the Simulation Data Inspector example, use these additional steps to display the TET data in the Simulation Data Inspector.
Open the
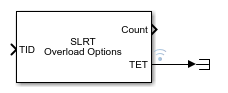
slrt_ex_oscmodel.mdlName = 'slrt_ex_osc'; openExample(mdlName);Add a SLRT Overload Options block to the model.
In the block, set the Enable TET Output parameter value to
on.Select the TET output and mark it for data logging in the Simulation Data Inspector.
Build the real-time application, load it on the target computer, and start the application. In Simulink Editor Real-Time tab, click Run on Target.
Open the Simulation Data Inspector.
When you run the real-time application, the TET data is displayed in the Simulation Data Inspector.
Version History
Introduced in R2020b