Check Custom Bounds
Check that model signal satisfies bounds during simulation
Libraries:
Simulink Design Optimization /
Model Verification
Simulink Design Optimization /
Signal Constraints
Description
Check that a signal satisfies the specified upper and lower bounds during simulation.
If the signal satisfies all bounds, the block does nothing.
If the signal does not satisfy a bound, a warning message appears in the MATLAB® command window. You can also specify that the block:
Evaluate a MATLAB expression.
Stop the simulation and return an error message.
During simulation, the block can also return a logical assertion signal.
If the signal satisfies all bounds, the assertion signal is true (
1).If the signal does not satisfy a bound, the assertion signal is false (
0).
Using the block, you can create:
A single bound with one edge
A single bound with multiple edges
Multiple bounds
You can add Check Custom Bounds blocks to multiple signals to check that they satisfy the bounds. You can also plot the bounds on a time plot to graphically verify that the signal satisfies the bounds.
This block and the other blocks in the Model Verification library test that a signal remains within specified time-domain characteristic bounds. When a model does not violate any bound, you can disable the block by clearing the assertion option. If you modify the model, you can re-enable assertion to ensure that your changes do not cause the model to violate a bound.
If the signal does not satisfy the bounds, you can optimize the model parameters to satisfy the bounds. If you have Simulink® Control Design™ software, you can add frequency-domain bounds, such as the Bode magnitude, and optimize the model response to satisfy both time-domain and frequency-domain requirements.
The block can be used in all simulation modes for signal monitoring, but only in
Normal or Accelerator simulation
mode for response optimization.
Examples

Inverted Pendulum Controller Tuning
Use Simulink® Design Optimization™ to optimize the controller of an inverted pendulum. The inverted pendulum is on a cart and the motion of the cart is controlled. The controller's Proportional, Feedforward and LQR gains are tuned to limit pendulum angle variations and respond to step changes in cart position optimally.

PID Tuning with Reference Tracking and Plant Uncertainty
Use Simulink® Design Optimization™ to track a reference signal and optimize the response with uncertainties in the plant model. The plant model consists of the plant transfer function and includes a Saturation block and a Rate Limits block. To view the results, use the following steps.

Power Converter Tuning
Use Simulink® Design Optimization™ to optimize the current controller parameters of a 3-phase thyristor converter. The model uses blocks from Simscape™ and Simscape Electrical™.
Ports
Input
Output
Parameters
Use the plot to view the following.
System characteristics and signals computed during simulation — Click this button before you simulate the model to view the system characteristics or signal.
You can display additional characteristics, such as the peak response time, by right-clicking the plot and selecting Characteristics.
Bounds — You can specify bounds on the Bounds tab or by right-clicking the plot and selecting Bounds > New Bound.
You can modify bounds by dragging the bound segment or by right-clicking the plot and selecting Bounds > Edit Bound. Before you simulate the model, click Update Block to update the bound value in the block parameters.
Typical tasks that you perform in the plot window include:
Opening the Block Parameters dialog box by clicking
 or selecting
Edit.
or selecting
Edit.Finding the block that the plot window corresponds to by clicking
 or selecting View > Highlight Simulink Block. This action makes the model window active and
highlights the block.
or selecting View > Highlight Simulink Block. This action makes the model window active and
highlights the block.Simulating the model by clicking
 . This action also linearizes the
portion of the model between the specified linearization input and
output.
. This action also linearizes the
portion of the model between the specified linearization input and
output.Adding a legend on the linear system characteristic plot by clicking
 .
.
Open the plot window instead of the block parameters when you double-click the block in the Simulink model.
Use this parameter if you prefer to open and perform tasks, such as adding
or modifying bounds, in the plot window instead of the block parameters. If
you want to access the block parameters from the plot window, select
Edit or click ![]() .
.
For more information on the plot, see the Show plot parameter.
Programmatic Use
Parameter:
LaunchViewOnOpen |
| Type: character vector |
Value:
'on' | 'off' |
Default:
'off' |
Open the Response Optimizer to optimize the model response to meet design requirements specified on the Bounds tab.
See Also
Bounds Tab
Check that a signal is less than or equal to the upper bounds, specified in the upper bound Times and Amplitudes, during simulation. The software displays a warning if the signal violates the upper bounds.
The bounds also appear on the time plot.
When you disable this parameter, the software stops checking that the input signal satisfies the upper bounds during simulation. The bound segments are also grayed out on the plot.
To view only the bounds and input signal on the plot, clear Enable assertion.
Dependencies
To use this parameter, on the Assertion tab, select Enable assertion. If you clear Enable assertion, the software does not use the bounds for assertion, but they continue to appear on the plot.
Programmatic Use
Parameter:
EnableUpperBound
|
| Type: character vector |
Value:
'on' | 'off'
|
Default:
'on'
|
Time vector for one or more upper bound segments, specified in seconds.
Specify the corresponding amplitude values in Amplitudes.
To specify a single bound with one edge, use a two-element vector. The vector must be of the form [Tstart Tend], where Tstart and Tend are positive finite numbers with Tstart < Tend.
For example, to create a single upper bound with an amplitude of 1.2 in a time interval of 0 to 10 seconds, specify
[0 10]for Times and[1.2 1.2]for Amplitudes.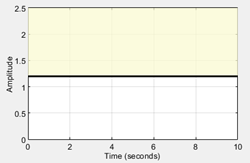
To specify a single bound with multiple edges, use a two-column matrix. The matrix must be of the form [T1 T2 ; T2 T3 ;…; Tn Tn+1], where n is the number of edges in the bound. A single bound with multiple edges is piecewise continuous, so specify time intervals such that the next edge begins at the same time where the previous edge ends.
For example, to create a single bound with two edges at times of 0–5 and 5–10 seconds with amplitudes of 1.2 and 1, respectively, specify
[0
										5;5 10]
for Times and[1.2 1.2;1 1]for Amplitudes.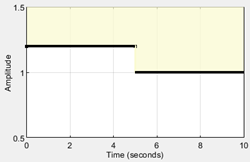
To specify multiple bounds, use a cell array of two-element vectors, two-column matrices, or both. That is, use a cell array of several single bounds.
For example, to create two bounds at times of 0–4 and 6–10 seconds with amplitudes of 1.2 and 1, respectively, specify
{[0 4] [6 10]}for Times and{[1.2 1.2] [1 1]}for Amplitudes.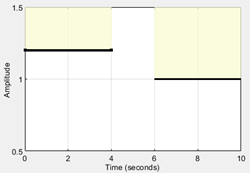
You can add or modify start and end times from the plot window.
To add new time vectors, right-click the yellow area on the plot and select Edit. Click Insert to add a new row to the Edit Bound dialog. box Specify the start and end times of the new bound segment in the Time column. Specify the corresponding amplitudes in the Amplitude column.
To modify the start and end times, drag the bound segment. Alternatively, right-click the segment, and select Edit. Specify the new times in the Time column.
Click Update Block before simulating the model.
To check that the input signal satisfies the amplitudes that correspond to the upper bound time vectors, select both Include upper bound in assertion and Enable assertion.
Programmatic Use
Parameter:
UpperBoundTimes
|
| Type: character vector |
| Value: two-element vector | two-column matrix | cell array |
Default:
[0 5; 5 10]
|
Amplitude values for one or more upper bound segments.
Specify the corresponding start and end times in Times.
To specify a single bound with one edge, use a two-element vector. The vector must be of the form [A1 A2], where A1 and A2 are the bound amplitudes at the corresponding edges of the time vector. For a constant amplitude throughout the time interval, use A1 = A2.
For example, to create a single upper bound with an amplitude of 1.2 in a time interval 0 to 10 seconds, specify
[0 10]for Times and[1.2 1.2]for Amplitudes.To specify a single bound with multiple edges, use a two-column matrix. The matrix must be of the form [A1 B1 ;…; An Bn], where n is the number of edges in the bound. For a constant amplitude throughout a time interval, use Ak = Bk, where k = 1,…,n
For example, to create a single bound with two edges at times of 0–5 and 5–10 seconds with amplitudes of 1.2 and 1, respectively, specify
[0 5;5 10]for Times and[1.2 1.2;1 1]for Amplitudes.To specify multiple bounds, use a cell array of two-element vectors, two-column matrices, or both. That is, use a cell array of several single bounds.
For example, to create two bounds at times of 0–4 and 6–10 seconds with amplitudes of 1.2 and 1, respectively, specify
{[0 4] [6 10]}for Times and{[1.2 1.2] [1 1]}for Amplitudes.
You can add or modify amplitudes from the plot window.
To add new amplitudes, right-click the plot and select Edit. Click Insert to add a new row to the Edit Bound dialog box. Specify the start and end amplitudes of the new bound segment in the Amplitude column. Specify the corresponding start and end times in the Time column.
To modify the start and end amplitudes, drag the bound segment. Alternatively, right-click the segment, and select Edit. Specify the new amplitudes in the Amplitude column.
Click Update Block before simulating the model.
To check that the input signal satisfies the upper amplitude bounds, select both Include upper bound in assertion and Enable assertion.
Programmatic Use
Parameter:
UpperBoundAmplitudes
|
| Type: character vector |
| Value: two-element vector | two-column matrix | cell array |
Default:
[1.1 1.1; 1.01 1.01]
|
Check that a signal is greater than or equal to the lower bounds, specified in the lower bound Times and Amplitudes, during simulation. The software displays a warning if the signal violates the lower bounds.
The bounds also appear on the time plot.
When this parameter is disabled, the lower bounds are disabled and the software stops checking that the bounds are satisfied during simulation. The bound segments are also greyed out on the plot.
To view only the bounds and input signal on the plot, clear Enable assertion.
Dependencies
To use this parameter, on the Assertion tab, select Enable assertion. If you clear Enable assertion, the software does not use the bounds for assertion, but they continue to appear on the plot.
Programmatic Use
Parameter:
EnableLowerBound
|
| Type: character vector |
Value:
'on' | 'off'
|
Default:
'off'
|
Time vector for one or more lower bound segments, specified in seconds.
Specify the corresponding amplitude values in Amplitudes.
To specify a single bound with one edge, use a two-element vector. The vector must be of the form [Tstart Tend], where Tstart and Tend are positive finite numbers with Tstart < Tend.
For example, to create a single lower bound with an amplitude of 0.8 in a time interval of 0 to 10 seconds, specify
[0 10]for Times and[0.8 0.8]for Amplitudes.
To specify a single bound with multiple edges, use a two-column matrix. The matrix must be of the form [T1 T2 ; T2 T3 ;…; Tn Tn+1], where n is the number of edges in the bound. A single bound with multiple edges is piecewise continuous, specify time intervals such that the next edge begins at the same time where the previous edge ends.
For example, to create a single bound with two edges at times of 0–5 and 5–10 seconds with amplitudes of 0.8 and 0.98, respectively, specify
[0 5;5 10]for Times and[0.8 0.8;0.98 0.98]for Amplitudes.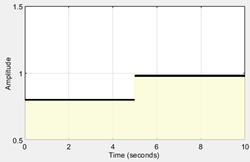
To specify multiple bounds, use a cell array of two-element vectors, two-column matrices, or both. That is, use a cell array of several single bounds.
For example, to create two bounds at times of 0–4 and 6–10 seconds with amplitudes of 0.8 and 0.98, respectively, specify
{[0 4] [6 10]}for Times and{[0.8 0.8] [0.98 0.98]}for Amplitudes.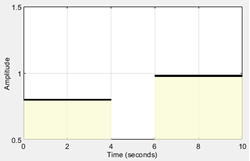
You can add or modify start and end times from the plot window.
To add new time vectors, right-click the yellow area on the plot and select Edit. Click Insert to add a new row to the Edit Bound dialog box. Specify the start and end times of the new bound segment in the Time column. Specify the corresponding amplitudes in the Amplitude column.
To modify the start and end times, drag the bound segment. Alternatively, right-click the segment, and select Edit. Specify the new times in the Time column.
Click Update Block before simulating the model.
To check that the input signal satisfies the amplitudes that correspond to the lower bound time vectors, select both Include lower bound in assertion and Enable assertion.
Programmatic Use
Parameter:
LowerBoundTimes
|
| Type: character vector |
| Value: two-element vector | two-column matrix | cell array |
Default:
[]
|
Amplitude values for one or more lower bound segments.
Specify the corresponding start and end times in Times.
To specify a single bound with one edge, use a two-element vector. The vector must be of the form [A1 A2], where A1 and A2 are the bound amplitudes at the corresponding edges of the time vector. For a constant amplitude throughout the time interval, use A1 = A2.
For example, to create a single lower bound with an amplitude of 0.8 in a time interval of 0 to 10 seconds, specify
[0 10]for Times and[0.8 0.8]for Amplitudes.To specify a single bound with multiple edges, use a two-column matrix. The matrix must be of the form [A1 B1 ;…; An Bn], where n is the number of edges in the bound. For a constant amplitude throughout a time interval, use Ak = Bk, where k = 1,…,n
For example, to create a single bound with two edges at times of 0–5 and 5–10 seconds with amplitudes of 0.8 and 0.98, respectively, specify
[0 5;5 10]for Times and[0.8 0.8;0.98 0.98]for Amplitudes.To specify multiple bounds, use a cell array of two-element vectors, two-column matrices, or both. That is, use a cell array of several single bounds.
For example, to create two bounds at times of 0–4 and 6–10 seconds with amplitudes of 0.8 and 0.98, respectively, specify
{[0 4] [6 10]}for Times and{[0.8 0.8] [0.98 0.98]}for Amplitudes.
You can add or modify amplitudes from the plot window.
To add new amplitudes, right-click the plot and select Edit. Click Insert to add a new row to the Edit Bound dialog box. Specify the start and end amplitudes of the new bound segment in the Amplitude column. Specify the corresponding start and end times in the Time column.
To modify the start and end amplitudes, drag the bound segment. Alternatively, right-click the segment, and select Edit. Specify the new amplitudes in the Amplitude column.
Click Update Block before simulating the model.
To check that the input signal satisfies the lower amplitude bounds, select both Include lower bound in assertion and Enable assertion.
Programmatic Use
Parameter:
LowerBoundAmplitudes
|
| Type: character vector |
| Value: two-element vector | two-column matrix | cell array |
Default:
[]
|
Ensure that the software simulates the model to produce output at the bound edges. Simulating the model at the bound edges prevents the simulation solver from missing an assertion that the signal satisfies that bound at its edge.
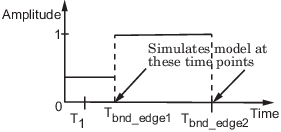
For more information, see Zero-Crossing Detection.
Programmatic Use
Parameter:
ZeroCross |
| Type: character vector |
Value:
'on' | 'off' |
Default:
'on' |
Assertion Tab
Enable the block to check that bounds specified and included for assertion on the Bounds tab are satisfied during simulation. Assertion fails if a bound is not satisfied. A warning, reporting the assertion failure, appears at the MATLAB prompt.
If the assertion fails, you can optionally specify that the block:
Execute a MATLAB expression, specified in Simulation callback when assertion fails (optional).
Stop the simulation and return an error message, by selecting Stop simulation when assertion fails.
This parameter has no effect if you do not specify any bounds.
When you disable this parameter, the block no longer checks that the input signal satisfies the specified bounds. The block icon also updates to indicate that assertion is disabled.
In the Simulink model, in the Configuration Parameters, the Model Verification block enabling parameter lets you enable or disable all model verification blocks in a model, regardless of the setting of this option in the block.
Programmatic Use
Parameter:
enabled |
| Type: character vector |
Value:
'on' | 'off' |
Default:
'on' |
MATLAB expression to execute when assertion fails.
Because the expression is evaluated in the MATLAB workspace, first define all variables used in the expression in the workspace.
Dependencies
To enable this parameter, select Enable assertion.
Programmatic Use
Parameter:
callback |
| Type: character vector |
| Value: MATLAB expression |
Default:
'' |
Stop the simulation when the signal violates a bound specified on the Bounds tab during simulation, that is, when assertion fails.
If you run the simulation from a Simulink model window, the Simulation Diagnostics window opens to display an error message. The block where the bound violation occurs is highlighted in the model.
Because selecting this option stops the simulation as soon as the assertion fails, the software does not report assertion failures that might occur later during the simulation. If you want to report all assertion failures, do not select this option.
Dependencies
To enable this parameter, select Enable assertion.
Programmatic Use
Parameter:
stopWhenAssertionFail |
| Type: character vector |
Value:
'on' | 'off' |
Default:
'off' |
Output a Boolean signal that, at each time step, is:
True (
1) if assertion succeeds, that is, the input signal satisfies all boundsFalse (
0) if assertion fails, that is, the input signal violates a bound
The data type of the output signal is double by default. To set the output data type as Boolean for all blocks that generate logic signals in your Simulink model, select Implement logic signals as Boolean data in Configuration Parameters.
Selecting this parameter adds an output port to the block that you can connect to any block in the model.
Use this parameter to design complex assertion logic. For an example, see Verify Model Using Simulink Control Design and Simulink Verification Blocks (Simulink Control Design).
Programmatic Use
Parameter:
export |
| Type: character vector |
Value:
'on' | 'off' |
Default:
'off' |
Extended Capabilities
Version History
Introduced in R2011b