Main Content

Hilbert Transform and Instantaneous Frequency

The Hilbert transform estimates the instantaneous frequency of a signal for monocomponent signals only. A monocomponent signal is described in the time-frequency plane by a single "ridge." The set of monocomponent signals includes single sinusoids and signals like chirps.

Generate a chirp sampled at 1 kHz for two seconds. Specify the chirp so its frequency is initially 100 Hz and increases to 200 Hz after one second.

fs = 1000;
t = 0:1/fs:2-1/fs;
y = chirp(t,100,1,200);

Estimate the spectrogram of the chirp using the short-time Fourier transform implemented in the pspectrum function. The signal is well described by a single peak frequency at each point in time.

pspectrum(y,fs,'spectrogram')

Figure contains an axes object. The axes object with title Fres = 10.267 Hz, Tres = 250 ms, xlabel Time (s), ylabel Frequency (Hz) contains an object of type image.

Compute the analytic signal and differentiate its phase to measure the instantaneous frequency. The scaled derivative yields a meaningful estimate.

z = hilbert(y);
instfrq = fs/(2*pi)*diff(unwrap(angle(z)));

clf
plot(t(2:end),instfrq)
ylim([0 fs/2])

Figure contains an axes object. The axes object contains an object of type line.

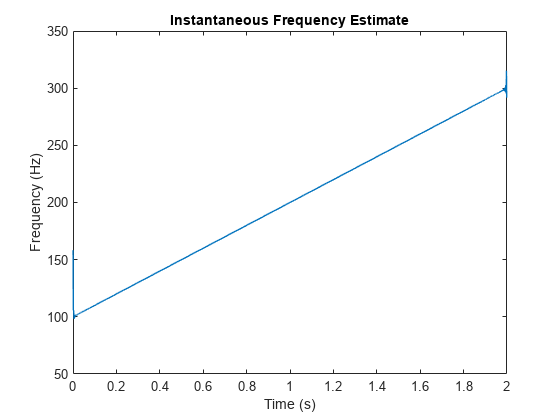
The instfreq function computes and displays the instantaneous frequency in one step.

instfreq(y,fs,'Method','hilbert')

Figure contains an axes object. The axes object with title Instantaneous Frequency Estimate, xlabel Time (s), ylabel Frequency (Hz) contains an object of type line.

The method fails when the signal is not monocomponent.

Generate a sum of two sinusoids of frequencies 60 Hz and 90 Hz, sampled at 1023 Hz for two seconds. Compute and plot the spectrogram. Each time point shows the presence of the two components.

fs = 1023;
t = 0:1/fs:2-1/fs;
x = sin(2*pi*60*t)+sin(2*pi*90*t);

pspectrum(x,fs,'spectrogram')
yticks([60 90])
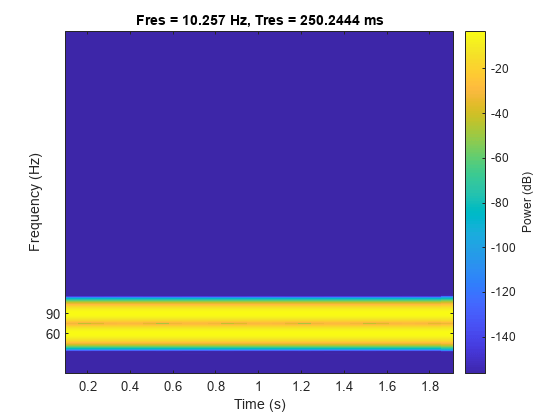
Figure contains an axes object. The axes object with title Fres = 10.257 Hz, Tres = 250.2444 ms, xlabel Time (s), ylabel Frequency (Hz) contains an object of type image.

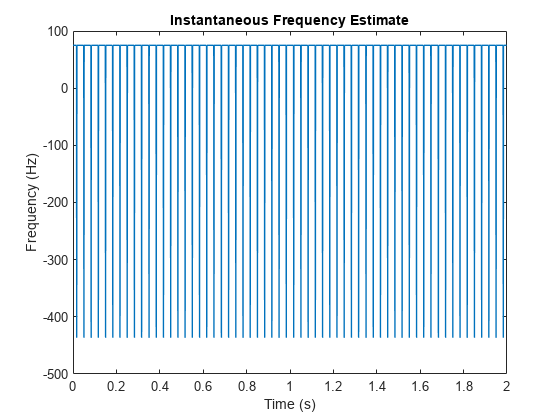
Compute the analytic signal and differentiate its phase. Zoom in on the region enclosing the frequencies of the sinusoids. The analytic signal predicts an instantaneous frequency that is the average of the sinusoid frequencies.

z = hilbert(x);
instfrq = fs/(2*pi)*diff(unwrap(angle(z)));

plot(t(2:end),instfrq)
ylim([60 90])
xlabel('Time (s)')
ylabel('Frequency (Hz)')

Figure contains an axes object. The axes object with xlabel Time (s), ylabel Frequency (Hz) contains an object of type line.

The instfreq function also estimates the average.

instfreq(x,fs,'Method','hilbert')

Figure contains an axes object. The axes object with title Instantaneous Frequency Estimate, xlabel Time (s), ylabel Frequency (Hz) contains an object of type line.

To estimate both frequencies as functions of time, use spectrogram to find the power spectral density and tfridge to track the two ridges. In tfridge, specify the penalty for changing frequency as 0.1.

[s,f,tt] = pspectrum(x,fs,'spectrogram');

numcomp = 2;
[fridge,~,lr] = tfridge(s,f,0.1,'NumRidges',numcomp);

pspectrum(x,fs,'spectrogram')
hold on
plot3(tt,fridge,abs(s(lr)),'LineWidth',4)
hold off
yticks([60 90])
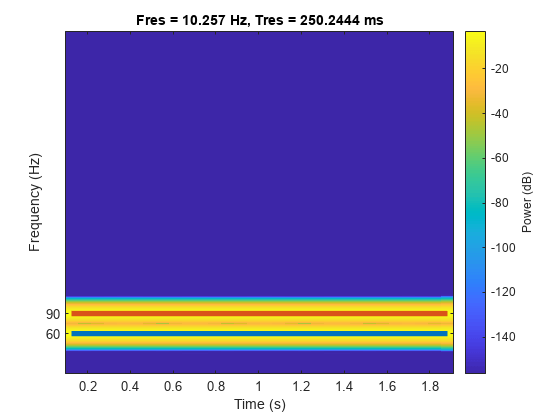
Figure contains an axes object. The axes object with title Fres = 10.257 Hz, Tres = 250.2444 ms, xlabel Time (s), ylabel Frequency (Hz) contains 3 objects of type image, line.

See Also

|

Related Topics

Go to top of page