show
Visualize path segment
Description
show(
also specifies pathSeg,Name,Value)Name,Value pairs to control display settings.
Examples
Create a dubinsConnection object.
dubConnObj = dubinsConnection;
Define start and goal poses as [x y theta] vectors.
startPose = [0 0 0];
goalPose = [1 1 pi];
Calculate a valid path segment to connect the poses.
[pathSegObj, pathCosts] = connect(dubConnObj,startPose,goalPose);
Show the generated path.
show(pathSegObj{1})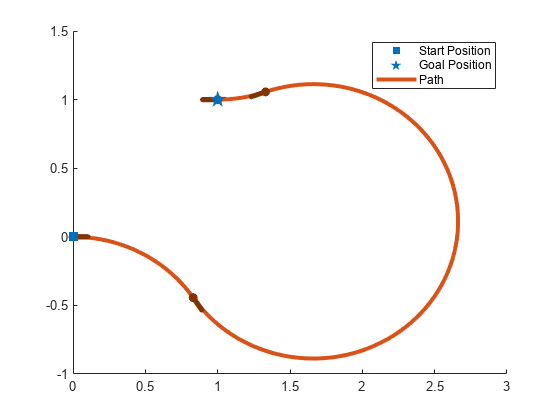
Create a reedsSheppConnection object.
reedsConnObj = reedsSheppConnection;
Define start and goal poses as [x y theta] vectors.
startPose = [0 0 0];
goalPose = [1 1 pi];
Calculate a valid path segment to connect the poses.
[pathSegObj,pathCosts] = connect(reedsConnObj,startPose,goalPose);
Show the generated path. Notice the direction of the turns.
show(pathSegObj{1})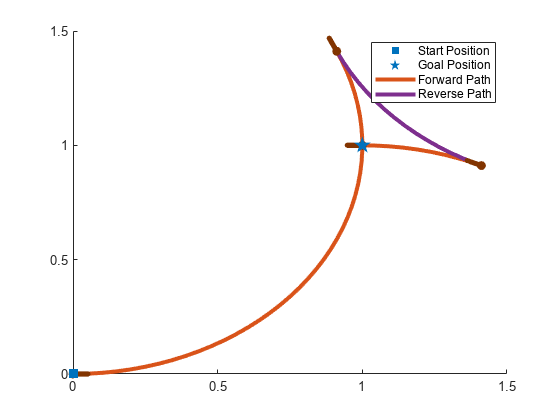
pathSegObj{1}.MotionTypesans = 1×5 cell
{'L'} {'R'} {'L'} {'N'} {'N'}
pathSegObj{1}.MotionDirectionsans = 1×5
1 -1 1 1 1
Disable this specific motion sequence in a new connection object. Reduce the MinTurningRadius if the robot is more maneuverable. Increase the reverse cost to reduce the likelihood of reverse directions being used. Connect the poses again to get a different path.
reedsConnObj = reedsSheppConnection('DisabledPathTypes',{'LpRnLp'});
reedsConnObj.MinTurningRadius = 0.5;
reedsConnObj.ReverseCost = 5;

[pathSegObj,pathCosts] = connect(reedsConnObj,startPose,goalPose);
pathSegObj{1}.MotionTypes
ans = 1×5 cell
    {'L'}    {'S'}    {'L'}    {'N'}    {'N'}
show(pathSegObj{1})
xlim([0 1.5])
ylim([0 1.5])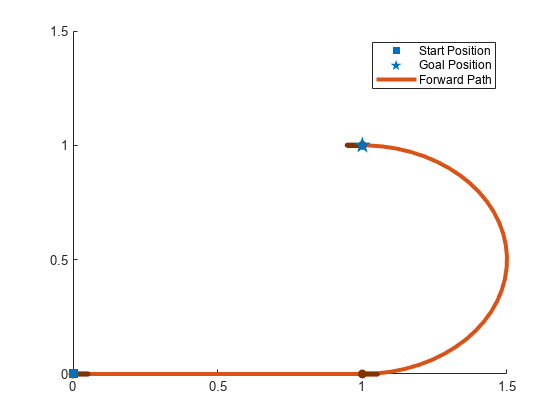
Create a dubinsConnection object.
dubConnObj = dubinsConnection;
Define start and goal poses as [x y theta] vectors.
startPose = [0 0 0];
goalPose = [1 1 pi];
Calculate a valid path segment to connect the poses.
[pathSegObj,pathCosts] = connect(dubConnObj,startPose,goalPose);
Show the generated path.
show(pathSegObj{1})
Interpolate poses along the path. Get a pose every 0.2 meters, including the transitions between turns.
length = pathSegObj{1}.Length;
poses = interpolate(pathSegObj{1},0:0.2:length)
poses = 32×3
0 0 0
0.1987 -0.0199 6.0832
0.3894 -0.0789 5.8832
0.5646 -0.1747 5.6832
0.7174 -0.3033 5.4832
0.8309 -0.4436 5.3024
0.8418 -0.4595 5.3216
0.9718 -0.6110 5.5216
1.1293 -0.7337 5.7216
1.3081 -0.8226 5.9216
1.5010 -0.8743 6.1216
1.7003 -0.8866 0.0384
1.8980 -0.8590 0.2384
2.0864 -0.7927 0.4384
2.2578 -0.6904 0.6384
⋮
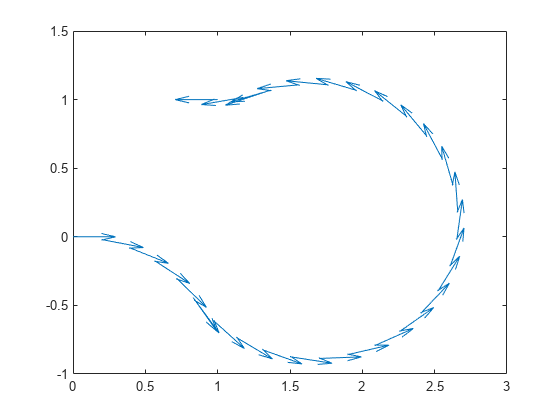
Use the quiver function to plot these poses.
quiver(poses(:,1),poses(:,2),cos(poses(:,3)),sin(poses(:,3)),0.5)
Input Arguments
Name-Value Arguments
Version History
Introduced in R2019b