semilogx
세미로그 플롯(x축에 로그 스케일이 있음)

구문
설명
벡터 및 행렬 데이터
semilogx(는 묵시적 x 좌표 집합에 대해 Y)Y를 플로팅합니다.
Y가 벡터인 경우 x좌표의 범위는 1에서length(Y)까지입니다.Y가 행렬인 경우 플롯은Y의 각 열에 대해 선 하나씩을 포함합니다. x 좌표의 범위는 1에서Y의 행 개수까지입니다.
Y가 복소수를 포함하는 경우 semilogx는 Y의 실수부에 대한 Y의 허수부를 플로팅합니다. 그러나 X와 Y를 모두 지정할 경우 MATLAB®은 허수부를 무시합니다.
테이블 데이터
추가 옵션
semilogx(___,는 하나 이상의 Name,Value)Name,Value 쌍의 인수를 사용하여 Line 속성을 지정합니다. 속성은 플로팅된 모든 선에 적용됩니다. 위에 열거된 구문에서 Name,Value 쌍을 모든 인수 뒤에 지정하십시오. 속성 목록은 Line 속성을 참조하십시오.
예제
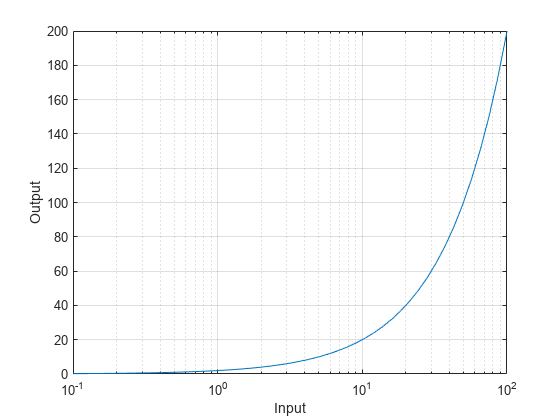
x를 구간 0.1부터 100까지의 로그 간격 값으로 구성된 벡터로 정의하고 y를 x의 복사본으로 정의합니다. x와 y의 선형-로그 플롯을 만들고, grid 함수를 호출하여 그리드 선을 표시합니다.
x = logspace(-1,2);
y = x;
semilogx(x,y)
grid on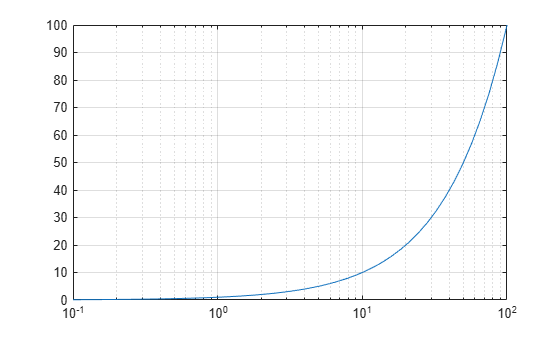
로그 간격 x 좌표로 구성된 벡터 하나와 y 좌표로 구성된 벡터 두 개를 만듭니다. 쉼표로 구분된 x-y 쌍을 semilogx에 전달하여 두 개의 선을 플로팅합니다.
x = logspace(-1,2);
y1 = x;
y2 = -x;
semilogx(x,y1,x,y2)
grid on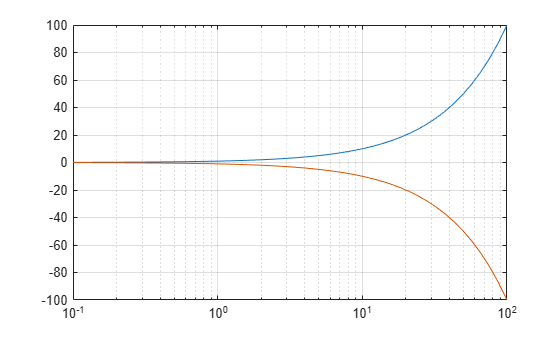
f를 10Hz부터 100,000Hz까지의 주파수를 포함하는 벡터로 정의합니다. gain을 데시벨 단위의 전력 이득 값으로 구성된 벡터로 정의합니다. 그런 다음 주파수에 대해 이득 값을 플로팅합니다.
f = logspace(1,5,100);
v = linspace(-50,50,100);
gain = (1-exp(5*(2.5*v.^2)./7500))/14;
semilogx(f,gain)
grid on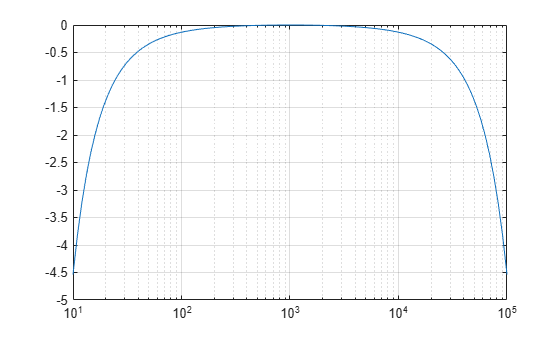
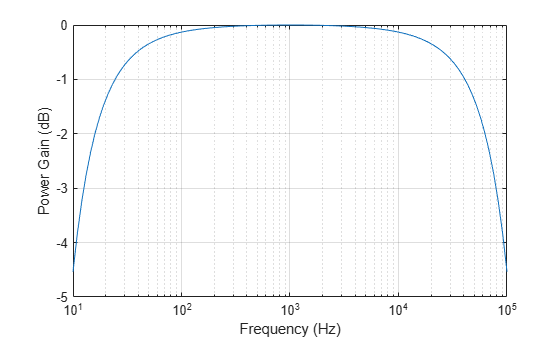
yticks 함수를 호출하여 y축을 따라 정수 크기로 증가하는 값의 위치에 y축 눈금 값을 재배치합니다. 그런 다음 xlabel 함수와 ylabel 함수를 호출하여 x축과 y축 레이블을 만듭니다.
yticks([-5 -4 -3 -2 -1 0])
xlabel ('Frequency (Hz)')
ylabel('Power Gain (dB)')
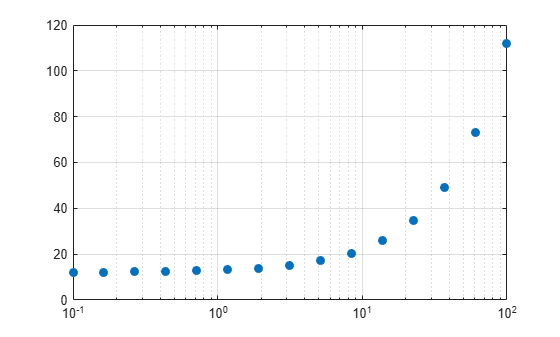
x, y 좌표로 구성된 집합을 만들고 이 집합을 선형-로그 플롯에 표시합니다. 선 스타일을 'o'로 지정하여 연결선이 없는 원형 마커를 표시합니다. 마커 채우기 색을 짙은 파란색에 해당하는 RGB 3색 [0 0.447 0.741]로 지정합니다.
x = logspace(-1,2,15);
y = 12 + x;
semilogx(x,y,'o','MarkerFaceColor',[0 0.447 0.741])
grid on
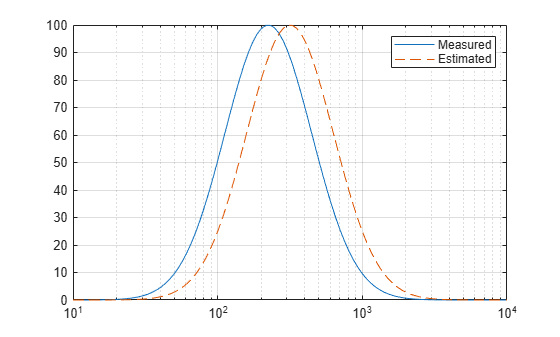
로그 간격 x 좌표로 구성된 벡터 하나와 y 좌표로 구성된 벡터 두 개를 만듭니다. 그런 다음 쉼표로 구분된 x-y 쌍을 semilogx에 전달하여 두 개의 선을 플로팅합니다. legend 함수를 호출하여 범례를 표시합니다.
x = logspace(1,4,100);
v = linspace(-50,50,100);
y1 = 100*exp(-1*((v+5).^2)./200);
y2 = 100*exp(-1*(v.^2)./200);
semilogx(x,y1,x,y2,'--')
legend('Measured','Estimated')
grid on
좌표 벡터를 하나만 지정하면 semilogx는 해당 좌표를 값 1:length(y)에 대해 플로팅합니다. 예를 들어, y를 0과 40 사이의 5개의 값으로 구성된 벡터로 정의합니다. y의 선형-로그 플롯을 만듭니다.
y = [0 10 20 30 40];
semilogx(y)
grid on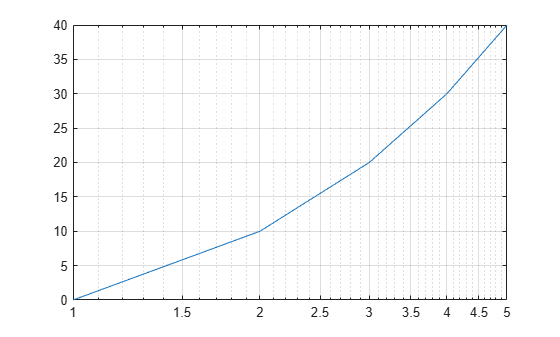
y를 행렬로 지정할 경우 y의 열이 값 1:size(y,1)에 대해 플로팅됩니다. 예를 들어, y를 5×3 행렬로 정의하고 semilogx 함수에 전달합니다. 결과로 생성되는 플롯은 각각 1과 5 사이의 x 좌표를 갖는 3개의 선을 포함합니다.
y = [ 0    10    20
     10    20    30
     20    30    40
     30    40    50
     40    50    60];

semilogx(y)
grid on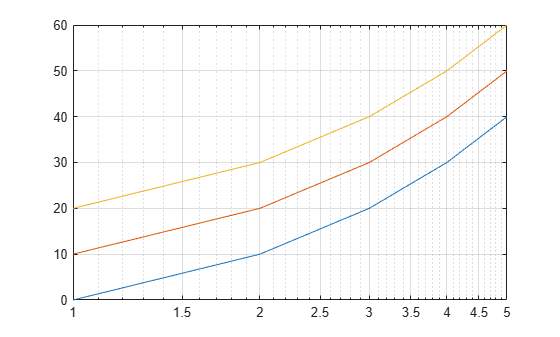
R2022a 이후
테이블을 semilogx 함수에 전달하고 플로팅할 변수를 지정하면 테이블의 데이터를 편리하게 플로팅할 수 있습니다.
2개의 변수를 포함하는 테이블을 만듭니다. 그런 다음 테이블의 처음 3개 행을 표시합니다.
Input = logspace(-1,2)';
Output = 2*Input;
tbl = table(Input,Output);
head(tbl,3)
     Input     Output
    _______    _______

        0.1        0.2
    0.11514    0.23028
    0.13257    0.26514
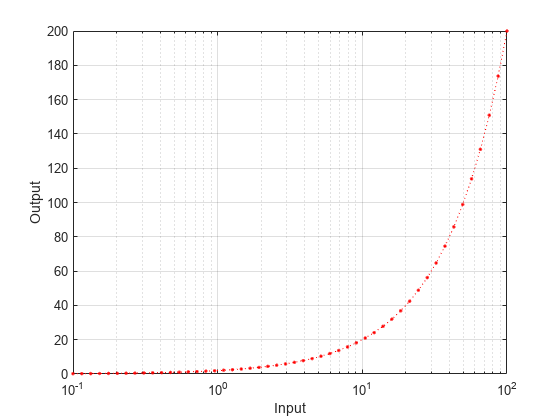
Input 변수는 x축에 플로팅하고 Output 변수는 y축에 플로팅합니다. Line 객체를 p로 반환하고 좌표축 그리드를 켭니다. 축 레이블이 변수 이름과 일치하는 것을 알 수 있습니다.
p = semilogx(tbl,"Input","Output");
grid on
선의 특성을 수정하려면 Line 객체에서 LineStyle 속성, Color 속성 및 Marker 속성을 설정하십시오. 예를 들어, 선을 점 마커가 있는 빨간색 점선으로 변경합니다.
p.LineStyle = ":";
p.Color = "red";
p.Marker = ".";
R2022a 이후
3개의 변수를 포함하는 테이블을 만듭니다. 그런 다음 테이블의 처음 3개 행을 표시합니다.
Input = logspace(-1,2)';
Output1 = 2*Input;
Output2 = -Input;
tbl = table(Input,Output1,Output2);
head(tbl,3)
     Input     Output1    Output2
    _______    _______    ________

        0.1        0.2        -0.1
    0.11514    0.23028    -0.11514
    0.13257    0.26514    -0.13257
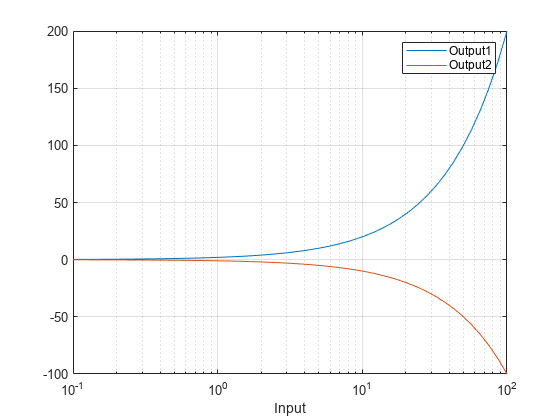
Input 변수는 x축에 플로팅하고 Output1 변수와 Output2 변수는 y축에 플로팅합니다. 범례를 추가합니다. 범례 레이블은 변수 이름과 일치합니다.
semilogx(tbl,"Input",["Output1" "Output2"])
grid on
legend
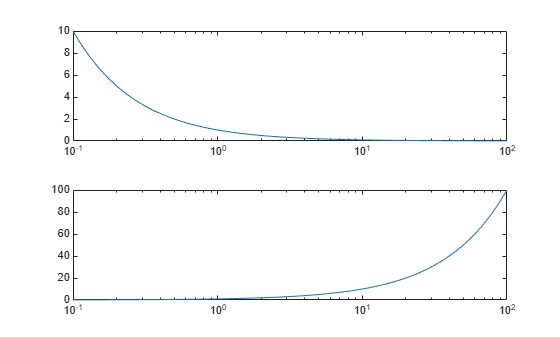
좌표축이 레이아웃의 사용 가능한 공간을 채우도록 'flow' 타일 배열로 타일 형식 차트 레이아웃을 만듭니다. 다음으로, nexttile 함수를 호출하여 axes 객체를 만들고 ax1로 반환합니다. 그런 다음 ax1을 semilogx 함수에 전달하여 선형-로그 플롯을 표시합니다.
tiledlayout('flow')
ax1 = nexttile;
x = logspace(-1,2);
y1 = 1./x;
semilogx(ax1,x,y1)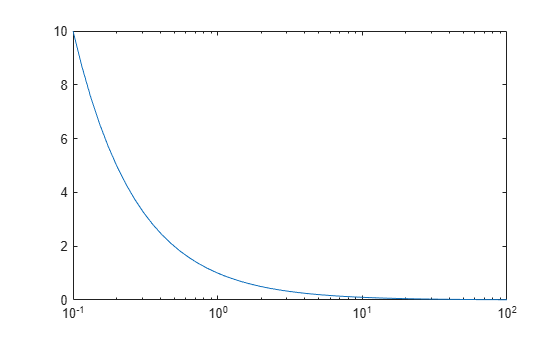
과정을 반복하여 두 번째 선형-로그 플롯을 만듭니다.
ax2 = nexttile;
y2 = x;
semilogx(ax2,x,y2)
두 개의 선을 포함하는 선형-로그 플롯을 만들고, line 객체를 변수 slg에 반환합니다.
x = logspace(-1,2);
y1 = x;
y2 = -x;
slg = semilogx(x,y1,x,y2);
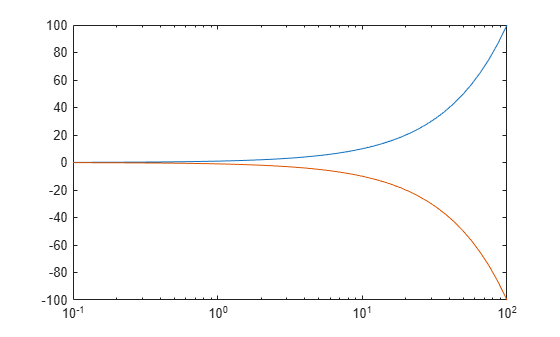
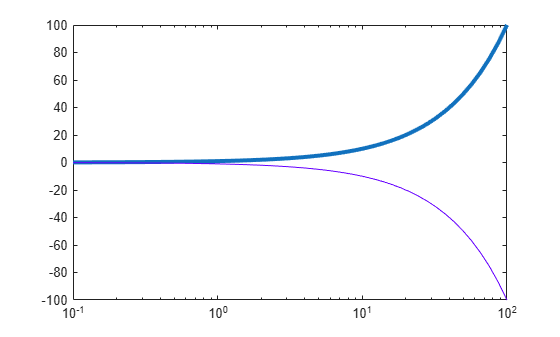
첫 번째 선의 너비를 3으로 변경하고 두 번째 선의 색을 자주색으로 변경합니다.
slg(1).LineWidth = 3;
slg(2).Color = [0.4 0 1];
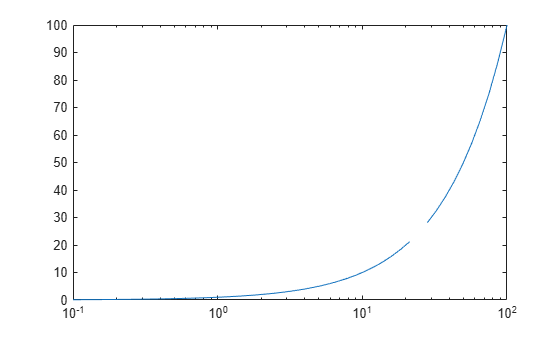
데이터에 불연속이 있는 곳마다 NaN 값을 삽입합니다. semilogx 함수는 해당 위치에 빈 간격을 표시합니다.
한 쌍의 x, y 좌표로 구성된 벡터를 만듭니다. 40번째 y 좌표를 NaN 값으로 바꿉니다. 그런 다음 x와 y의 선형-로그 플롯을 만듭니다.
x = logspace(-1,2);
y = x;
y(40) = NaN;
semilogx(x,y)
입력 인수
로그 스케일 좌표로, 스칼라, 벡터 또는 행렬로 지정됩니다. X의 크기와 형태는 데이터의 형태와 만들고자 하는 플롯의 유형에 따라 결정됩니다. 다음 표에서는 가장 일반적인 경우를 설명합니다.
| 플롯 유형 | 좌표 지정 방법 |
|---|---|
| 단일 점 |
semilogx(1,2,'o') |
| 하나의 점 집합 |
semilogx([1 2 3],[4; 5; 6]) |
| 여러 개의 점 집합 (벡터 사용) |
semilogx([1 2 3],[4 5 6],[1 2 3],[7 8 9]) |
| 여러 개의 점 집합 (행렬 사용) | 모든 집합이 동일한 x 좌표 또는 y 좌표를 공유하는 경우, 공유되는 좌표를 벡터로 지정하고 나머지 좌표를 행렬로 지정합니다. 벡터의 길이는 행렬의 차원 중 하나와 일치해야 합니다. 예를 들면 다음과 같습니다. semilogx([1 2 3],[4 5 6; 7 8 9]) semilogx는 행렬의 각 열에 대해 선 하나씩을 플로팅합니다. 또는 semilogx([1 2 3; 4 5 6],[7 8 9; 10 11 12]) |
다음과 같은 경우 semilogx는 좌표를 제외할 수 있습니다.
로그 스케일 좌표에 양수 값과 음수 값이 포함된 경우, 양의 값만 표시됩니다.
로그 스케일 좌표가 모두 음수인 경우, 모든 값이 적절한 부호와 함께 로그 스케일에 표시됩니다.
로그 스케일 값 0은 표시되지 않습니다.
데이터형: single | double | int8 | int16 | int32 | int64 | uint8 | uint16 | uint32 | uint64
선형 스케일 좌표로, 스칼라, 벡터 또는 행렬로 지정됩니다. Y의 크기와 형태는 데이터의 형태와 만들려는 플롯의 유형에 따라 결정됩니다. 다음 표에서는 가장 일반적인 경우를 설명합니다.
| 플롯 유형 | 좌표 지정 방법 |
|---|---|
| 단일 점 |
semilogx(1,2,'o') |
| 하나의 점 집합 |
semilogx([1 2 3],[4; 5; 6]) |
| 여러 개의 점 집합 (벡터 사용) |
semilogx([1 2 3],[4 5 6],[1 2 3],[7 8 9]) |
| 여러 개의 점 집합 (행렬 사용) | 모든 집합이 동일한 x 좌표 또는 y 좌표를 공유하는 경우, 공유되는 좌표를 벡터로 지정하고 나머지 좌표를 행렬로 지정합니다. 벡터의 길이는 행렬의 차원 중 하나와 일치해야 합니다. 예를 들면 다음과 같습니다. semilogx([1 2 3],[4 5 6; 7 8 9]) semilogx는 행렬의 각 열에 대해 선 하나씩을 플로팅합니다.또는 semilogx([1 2 3; 4 5 6],[7 8 9; 10 11 12]) |
데이터형: single | double | int8 | int16 | int32 | int64 | uint8 | uint16 | uint32 | uint64 | categorical | datetime | duration
선 스타일, 마커, 색으로, 기호를 포함하는 string형 스칼라 또는 문자형 벡터로 지정됩니다. 기호는 어떤 순서로 지정해도 좋습니다. 세 가지 특성(선 스타일, 마커, 색)을 모두 지정할 필요는 없습니다. 예를 들어 선 스타일을 생략하고 마커를 지정하면 플롯은 마커만 표시하고 선은 표시하지 않습니다.
예: "--or"은 원 마커로 표시된 빨간색 파선입니다.
| 선 스타일 | 설명 | 결과 선 |
|---|---|---|
"-" | 실선 |
|
"--" | 파선 |
|
":" | 점선 |
|
"-." | 일점 쇄선 |
|


| 마커 | 설명 | 결과로 생성되는 마커 |
|---|---|---|
"o" | 원 |
|
"+" | 플러스 기호 |
|
"*" | 별표 |
|
"." | 점 |
|
"x" | 십자 |
|
"_" | 가로선 |
|
"|" | 세로선 |
|
"square" | 정사각형 |
|
"diamond" | 다이아몬드 |
|
"^" | 위쪽 방향 삼각형 |
|
"v" | 아래쪽 방향 삼각형 |
|
">" | 오른쪽 방향 삼각형 |
|
"<" | 왼쪽 방향 삼각형 |
|
"pentagram" | 펜타그램 |
|
"hexagram" | 헥사그램 |
|


| 색 이름 | 짧은 이름 | RGB 3색 | 모양 |
|---|---|---|---|
"red" | "r" | [1 0 0] |
|
"green" | "g" | [0 1 0] |
|
"blue" | "b" | [0 0 1] |
|
"cyan" | "c" | [0 1 1] |
|
"magenta" | "m" | [1 0 1] |
|
"yellow" | "y" | [1 1 0] |
|
"black" | "k" | [0 0 0] |
|
"white" | "w" | [1 1 1] |
|


플로팅할 데이터를 포함하는 소스 테이블로, 테이블 또는 타임테이블로 지정됩니다.
x 좌표를 포함하는 테이블 변수로, 다음 표의 인덱싱 방식 중 하나를 사용하여 지정됩니다.
| 인덱싱 방식 | 예제 |
|---|---|
변수 이름:
|
|
변수 인덱스:
|
|
변수 유형:
|
|
사용자가 지정하는 테이블 변수에는 임의의 숫자형 값이 포함될 수 있습니다. 그러나 semilogx는 X를 음수 값 또는 0 값을 포함하는 벡터로 지정할 때와 동일한 방식으로 플롯에서 음수 값 또는 0 값을 제외할 수 있습니다.
xvar과 yvar이 둘 다 여러 개의 변수를 지정하는 경우에는 동일한 개수의 변수를 지정해야 합니다.
예: semilogx(tbl,["x1","x2"],"y")는 x 좌표에 대해 x1과 x2라는 테이블 변수를 지정합니다.
예: semilogx(tbl,2,"y")는 x 좌표에 대해 두 번째 변수를 지정합니다.
예: semilogx(tbl,vartype("numeric"),"y")는 x 좌표에 대해 모든 숫자형 변수를 지정합니다.
y 좌표를 포함하는 테이블 변수로, 다음 표의 인덱싱 방식 중 하나를 사용하여 지정됩니다.
| 인덱싱 방식 | 예제 |
|---|---|
변수 이름:
|
|
변수 인덱스:
|
|
변수 유형:
|
|
사용자가 지정하는 테이블 변수는 숫자형 값, categorical형 값, datetime형 값 또는 duration형 값을 포함할 수 있습니다. xvar과 yvar이 둘 다 여러 개의 변수를 지정하는 경우에는 동일한 개수의 변수를 지정해야 합니다.
예: semilogx(tbl,"x",["y1","y2"])는 y 좌표에 대해 y1과 y2라는 테이블 변수를 지정합니다.
예: semilogx(tbl,"x",2)는 y 좌표에 대해 두 번째 변수를 지정합니다.
예: semilogx(tbl,"x",vartype("numeric"))은 y 좌표에 대해 모든 숫자형 변수를 지정합니다.
대상 좌표축으로, Axes 객체로 지정됩니다. 좌표축을 지정하지 않을 경우 현재 좌표축이 카테시안(Cartesian)이면 semilogx는 현재 좌표축을 사용합니다.
이름-값 인수
선택적 인수 쌍을 Name1=Value1,...,NameN=ValueN으로 지정합니다. 여기서 Name은 인수 이름이고 Value는 대응값입니다. 이름-값 인수는 다른 인수 뒤에 와야 하지만, 인수 쌍의 순서는 상관없습니다.
R2021a 이전 릴리스에서는 쉼표를 사용하여 각 이름과 값을 구분하고 Name을 따옴표로 묶으십시오.
예: semilogx([1 2],[3 4],'Color','red')는 플롯에 대해 빨간색 선을 지정합니다.
참고
여기에 나와 있는 속성은 일부에 불과합니다. 전체 목록을 보려면 Line 속성을 참조하십시오.
색으로, RGB 3색, 16진수 색 코드, 색 이름 또는 짧은 이름으로 지정됩니다. 지정한 색이 선 색으로 설정됩니다. 또한, MarkerEdgeColor 속성이 'auto'로 설정된 경우 지정한 색이 마커 가장자리 색도 설정합니다.
사용자 지정 색의 경우에는 RGB 3색 또는 16진수 색 코드를 지정하십시오.
RGB 3색은 요소를 3개 가진 행 벡터로, 각 요소는 색을 구성하는 빨간색, 녹색, 파란색의 농도를 지정합니다. 농도의 범위는
[0,1]이어야 합니다(예:[0.4 0.6 0.7]).16진수 색 코드는 string형 스칼라 또는 문자형 벡터로, 해시 기호(
#)로 시작하고 그 뒤에 3자리 또는 6자리의 16진수 숫자(0에서F사이일 수 있음)가 옵니다. 이 값은 대/소문자를 구분하지 않습니다. 따라서 색 코드"#FF8800","#ff8800","#F80"및"#f80"은 모두 동일합니다.
몇몇의 흔한 색은 이름으로 지정할 수도 있습니다. 다음 표에는 명명된 색 옵션과 그에 해당하는 RGB 3색 및 16진수 색 코드가 나와 있습니다.
| 색 이름 | 짧은 이름 | RGB 3색 | 16진수 색 코드 | 모양 |
|---|---|---|---|---|
"red" | "r" | [1 0 0] | "#FF0000" |
|
"green" | "g" | [0 1 0] | "#00FF00" |
|
"blue" | "b" | [0 0 1] | "#0000FF" |
|
"cyan" | "c" | [0 1 1] | "#00FFFF" |
|
"magenta" | "m" | [1 0 1] | "#FF00FF" |
|
"yellow" | "y" | [1 1 0] | "#FFFF00" |
|
"black" | "k" | [0 0 0] | "#000000" |
|
"white" | "w" | [1 1 1] | "#FFFFFF" |
|
"none" | 해당 없음 | 해당 없음 | 해당 없음 | 색 없음 |
다음 표에는 라이트 테마와 다크 테마에서 플롯의 디폴트 색 팔레트가 나열되어 있습니다.
| 팔레트 | 팔레트 색 |
|---|---|
R2025a 이전: 대부분의 플롯은 기본적으로 이 색을 사용합니다. |
|
|
|


orderedcolors 함수와 rgb2hex 함수를 사용하여 이러한 팔레트의 RGB 3색과 16진수 색 코드를 가져올 수 있습니다. 예를 들어, "gem" 팔레트의 RGB 3색을 가져와서 16진수 색 코드로 변환해 보겠습니다.
RGB = orderedcolors("gem");
H = rgb2hex(RGB);
R2023b 이전: RGB = get(groot,"FactoryAxesColorOrder")를 사용하여 RGB 3색을 가져옵니다.
R2024a 이전: H = compose("#%02X%02X%02X",round(RGB*255))를 사용하여 16진수 색 코드를 가져옵니다.
몇몇의 흔한 색은 이름으로 지정할 수도 있습니다. 다음 표에는 명명된 색 옵션과 그에 해당하는 RGB 3색 및 16진수 색 코드가 나와 있습니다.
| 색 이름 | 짧은 이름 | RGB 3색 | 16진수 색 코드 | 모양 |
|---|---|---|---|---|
"red" | "r" | [1 0 0] | "#FF0000" |
|
"green" | "g" | [0 1 0] | "#00FF00" |
|
"blue" | "b" | [0 0 1] | "#0000FF" |
|
"cyan" | "c" | [0 1 1] | "#00FFFF" |
|
"magenta" | "m" | [1 0 1] | "#FF00FF" |
|
"yellow" | "y" | [1 1 0] | "#FFFF00" |
|
"black" | "k" | [0 0 0] | "#000000" |
|
"white" | "w" | [1 1 1] | "#FFFFFF" |
|
"none" | 해당 없음 | 해당 없음 | 해당 없음 | 색 없음 |
다음 표에는 라이트 테마와 다크 테마에서 플롯의 디폴트 색 팔레트가 나열되어 있습니다.
| 팔레트 | 팔레트 색 |
|---|---|
R2025a 이전: 대부분의 플롯은 기본적으로 이 색을 사용합니다. |
|
|
|
orderedcolors 함수와 rgb2hex 함수를 사용하여 이러한 팔레트의 RGB 3색과 16진수 색 코드를 가져올 수 있습니다. 예를 들어, "gem" 팔레트의 RGB 3색을 가져와서 16진수 색 코드로 변환해 보겠습니다.
RGB = orderedcolors("gem");
H = rgb2hex(RGB);
R2023b 이전: RGB = get(groot,"FactoryAxesColorOrder")를 사용하여 RGB 3색을 가져옵니다.
R2024a 이전: H = compose("#%02X%02X%02X",round(RGB*255))를 사용하여 16진수 색 코드를 가져옵니다.
팁
semilogx함수는 좌표축의ColorOrder속성과LineStyleOrder속성을 기반으로 색과 선 스타일을 사용합니다.semilogx는 첫 번째 선 스타일에 색을 순서대로 돌아가며 적용합니다. 그런 다음, 각 추가적인 선 스타일에 다시 색을 순서대로 돌아가며 적용합니다.좌표축에 대한
ColorOrder속성 또는LineStyleOrder속성을 설정하여 플로팅 후 색과 선 스타일을 변경할 수 있습니다. 또한colororder함수를 호출하여 Figure에서 모든 좌표축에 대해 색 순서를 변경할 수 있습니다.
알고리즘
semilogx 함수는 좌표축의 XScale 속성을 'log'로 설정하여 x 좌표를 로그 스케일에 플로팅합니다. 그러나 semilogx를 호출하기 전에 좌표축의 hold 상태가 'on'인 경우, 해당 속성은 변경되지 않고 x 좌표가 선형 스케일에 표시될 수 있습니다.
확장 기능
버전 내역
R2006a 이전에 개발됨테이블과 하나 이상의 변수 이름을 semilogx 함수에 전달하면 축 및 범례 레이블에 테이블 변수 이름에 포함된 특수 문자(예: 밑줄)가 표시됩니다. 이전에는 특수 문자를 TeX 또는 LaTeX 문자로 해석했습니다.
예를 들어, Sample_Number라는 변수가 포함된 테이블을 semilogx 함수에 전달하면 축과 범례 레이블에 밑줄이 나타납니다. R2022a 이하 릴리스에서는 밑줄이 첨자로 해석됩니다.
| 릴리스 | 테이블 변수 "Sample_Number"의 레이블 |
|---|---|
R2022b |
|
R2022a |
|


TeX 또는 LaTeX 형식으로 축과 범례 레이블을 표시하려면 수동으로 레이블을 지정하십시오. 예를 들어 플로팅 후 원하는 레이블 문자열과 함께 xlabel 또는 legend 함수를 호출합니다.
xlabel("Sample_Number")
legend(["Sample_Number" "Another_Legend_Label"])