RGB 영상의 분리된 색 채널 표시하기
이 예제에서는 간단한 RGB 영상을 만들어서 색 채널을 분리해 보겠습니다. 또한 각 색 채널을 회색조 명암 영상과 컬러 영상으로 표시해 봅니다.
빨간색, 녹색, 파란색 영역이 연속해서 이어지는 RGB 영상을 만듭니다. 영상을 표시합니다.
imSize = 200;
RGB = reshape(ones(imSize,1)*reshape(jet(imSize),1,imSize*3),[imSize,imSize,3]);
imshow(RGB)
title('Original RGB Image')
3개의 색 채널을 분리합니다.
[R,G,B] = imsplit(RGB);
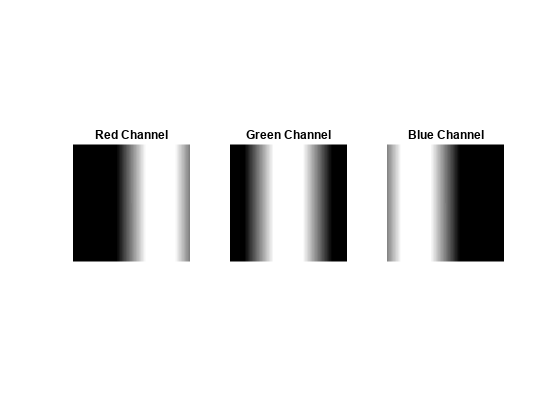
각 색 채널의 회색조 표현을 표시합니다. Figure에서 각각의 분리된 색 평면마다 흰색 영역이 있는 것을 볼 수 있습니다. 흰색은 각 분리된 색의 가장 높은 값(가장 순수한 음영)에 해당합니다. 예를 들어, 빨간색 채널 영상에서 흰색은 빨강의 순색 값이 가장 높은 영역을 나타냅니다. 빨간색에 녹색이나 파란색이 섞이면서 회색 픽셀이 나타나게 됩니다. 영상에서 검은색 영역은 빨간색 값이 전혀 포함되지 않은 픽셀 값, 다시 말해서 R == 0인 영역입니다.
figure
subplot(1,3,1)
imshow(R)
title('Red Channel')

subplot(1,3,2)
imshow(G)
title('Green Channel')

subplot(1,3,3)
imshow(B)
title('Blue Channel')
각 색 채널의 색 표현을 표시합니다. 이들 영상에서 원하는 색 채널은 원래 명암 값을 유지하고, 나머지 두 색 채널의 픽셀 값은 0으로 설정합니다.
검은색 채널을 만듭니다.
allBlack = zeros(size(RGB,1,2),class(RGB));
justR = cat(3,R,allBlack,allBlack);
justG = cat(3,allBlack,G,allBlack);
justB = cat(3,allBlack,allBlack,B);
모든 채널을 몽타주로 표시합니다.
figure
montage({justR,justG,justB},'Size',[1 3], ...
    "BackgroundColor",'w',"BorderSize",10);
title('Color Representation of the Red, Green, and Blue Color Channels');