idfrd
Frequency response data or model
Description
An idfrd object stores frequency response data over a range of
frequency values. You can use an idfrd object in two ways. You can use the
object as estimation data for estimating a time-domain or frequency-domain model, similarly to
an iddata object. Or, you can use the object as a linear model, similarly to
how you use an idss state-space model or any other identified linear model.
Use the idfrd command to encapsulate frequency response data or to
convert a linear time-domain or frequency-domain dynamic model into a frequency response
model.
Commands that accept iddata objects, such as the model estimation
command ssest, generally also accept
idfrd objects. However, an idfrd object can contain
data from only one experiment. It does not have the multiexperiment capability that an
iddata object has.
Commands that accept identified linear models, such as the analysis and validation
commands compare, sim, and bode, generally also accept
idfrd models.
For a model of the form
the transfer function estimate is and the additive noise spectrum Φv at the output is
Here, λ is the estimated variance of e(t) and T is the sample time.
For a continuous-time system, the noise spectrum is
An idfrd object stores and Φv.
Creation
You can obtain an idfrd model in one of three ways.
Create the model from frequency response data using the
idfrdcommand. For example, create anidfrdmodel that encapsulates frequency response data taken at specific frequencies using the sample timeTs.For an example, see Create idfrd Object from Frequency Response Data.sysfr = idfrd(ResponseData,Freq,Ts)
Estimate the model using a frequency response estimation command such as
spa, using time-domain, frequency-domain, or frequency response data.sysfr = spa(data)
For more information about frequency response estimation commands, see
spa,spafdr, andetfe.Convert a linear model such as an
idssmodel into anidfrdmodel by computing the frequency response of the model.For an example of linear model conversion, see Convert Time-Domain Model to Frequency Response Model.sysfr = idfrd(sys)
For information on functions you can use to extract information from or transform
idfrd model objects, see Object Functions.
Syntax
Description
Create Frequency Response Object
sysfr = idfrd(ResponseData,Frequency,Ts)idfrd object that stores the frequency response
ResponseData of a linear system at frequency values Frequency. Ts is the sample time. For a continuous-time system, set
Ts to 0.
sysfr = idfrd(___,Name,Value)sysfr =
idfrd(ResponseData,Frequency,Ts,'FrequencyUnits','MHz').
Convert Linear Identified Model to Frequency Response Model
sysfr = idfrd(sys)
sysfr = idfrd(sys,Frequency,FrequencyUnits)Frequency vector in the units
specified by FrequencyUnit.
Input Arguments
Properties
Object Functions
Many functions applicable to Dynamic System Models are also applicable to an idfrd model
object. These functions are of three general types.
Functions that operate on and return
idfrdmodel objects, such aschgTimeUnitandchgFreqUnitFunctions that perform analytical and simulation functions on
idfrdobjects, such asbodeandsimFunctions that retrieve or interpret model information, such as
getcov
Unlike other identified linear models, you cannot directly convert an
idfrd model into another model type using commands such as
idss or idtf. Instead, use the estimation command
for the model you want, using the idfrd object as the estimation data. For
instance, use sys = ssest(sysfr,2) to estimate a second-order state-space
model from the frequency response data in idfrd model
sysfr. For an example of using an idfrd object as
estimation data, see Estimate Time-Domain Model Using Frequency Response Data.
The following lists contain a representative subset of the functions that you can use with
idss models.
Examples
Create an idfrd object from frequency response data.
Load the magnitude data AMP, the phase data PHA, and the frequency vector W. Set sample time Ts to 0.1.
load demofr AMP PHA W
Ts = 0.1;
Use the values of AMP and PHA to compute the complex-valued response response.
response = AMP.*exp(1j*PHA*pi/180);
Create an idfrd object to store response in the idfrd object frdata.
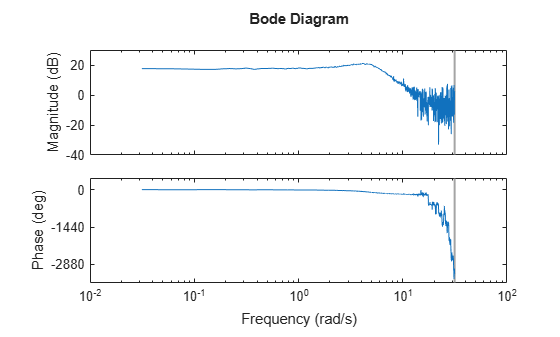
frdata = idfrd(response,W,Ts)
frdata =
IDFRD model.
Contains Frequency Response Data for 1 output(s) and 1 input(s).
Response data is available at 1000 frequency points, ranging from 0.03142 rad/s to 31.42 rad/s.

Sample time: 0.1 seconds
Status:
Created by direct construction or transformation. Not estimated.

Model Properties
Plot the data.
bode(frdata)
frdata is a complex idfrd object with object properties that you can access using dot notation. For example, confirm the value of Ts.
tsproperty = frdata.Ts
tsproperty =
0.1000
You can also set property values. Set the Name property to 'DC_Converter'.
frdata.Name = 'DC_Converter';If you import frdata into the System Identification app, the app names this data DC_Converter, and not the variable name frdata.
Use get to obtain the full set of property settings.
get(frdata)
      FrequencyUnit: 'rad/TimeUnit'
             Report: [1×1 idresults.frdest]
       SpectrumData: []
     CovarianceData: []
    NoiseCovariance: []
        InterSample: {'zoh'}
       ResponseData: [1×1×1000 double]
            IODelay: 0
         InputDelay: 0
        OutputDelay: 0
          InputName: {''}
          InputUnit: {''}
         InputGroup: [1×1 struct]
         OutputName: {''}
         OutputUnit: {''}
        OutputGroup: [1×1 struct]
              Notes: [0×1 string]
           UserData: []
               Name: 'DC_Converter'
                 Ts: 0.1000
           TimeUnit: 'seconds'
       SamplingGrid: [1×1 struct]
          Frequency: [1000×1 double]
Convert a state-space model to a frequency response model using the idfrd command.
Load the data z2 and estimate a second-order state-space model sys.
load iddata2 z2
sys = ssest(z2,2);
Convert sys to the idfrd model frsys.
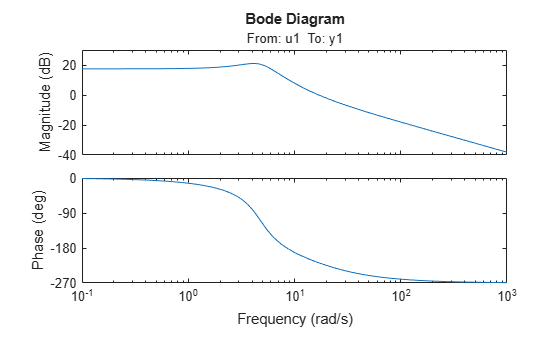
frsys = idfrd(sys)
frsys =
IDFRD model.
Contains Frequency Response Data for 1 output(s) and 1 input(s), and the spectra for disturbances at the outputs.
Response data and disturbance spectra are available at 68 frequency points, ranging from 0.1 rad/s to 1000 rad/s.

Output channels: 'y1'
Input channels: 'u1'
Status:
Created by conversion from idss model.

Model Properties
Plot frsys.
bode(frsys)
frsys is an idfrd model that you can use as a dynamic system model or as estimation data for a time-domain or frequency-domain model.
Obtain the frequency response of a transfer function model and convert the response into an idfrd object.
Construct a transfer function model with one zero and three poles.
systf = idtf([1 .2],[1 2 1 1]);
Use bode to obtain the frequency response of systf, in terms of magnitude and phase, for the frequency vector f.
f = logspace(-1,1,100);
[mag,phase] = bode(systf,f);
Use the values of mag and phase to compute the complex-valued response response.
response = mag.*exp(1j*phase*pi/180);
Create an idfrd object frdata to store response, specifying a sample rate Ts of 0.8.
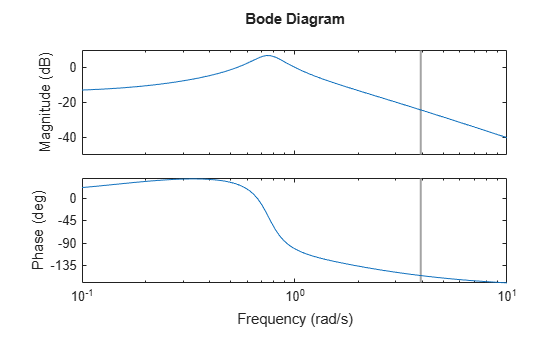
Ts = 0.8;
frdata = idfrd(response,f,Ts)
frdata =
IDFRD model.
Contains Frequency Response Data for 1 output(s) and 1 input(s).
Response data is available at 100 frequency points, ranging from 0.1 rad/s to 10 rad/s.

Sample time: 0.8 seconds
Status:
Created by direct construction or transformation. Not estimated.

Model Properties
Plot the data.
bode(frdata)
frdata is a complex idfrd object.
Estimate a transfer function model from time-domain data and convert the resulting idtf model to an idfrd model. Estimate a new transfer function model from the frequency response data in the idfrd model. Compare the model responses with the original data.
Load time-domain data z2 and use it to estimate a transfer function sys that has two poles and one zero.
load iddata2 z2
sys = tfest(z2,2,1);
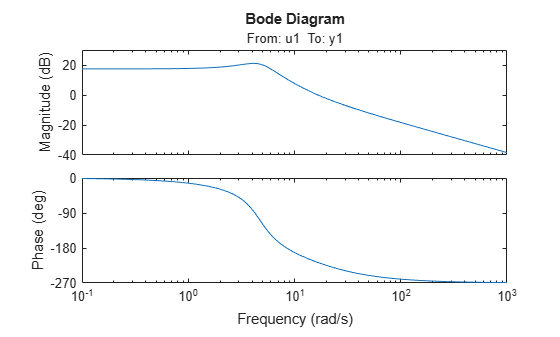
Convert sys to an idfrd model and plot the frequency response.
frsys = idfrd(sys);
bode(sys)
Estimate a new transfer function sys1 using the data from frsys as the estimation data.
sys1 = tfest(frsys,2,1);
Compare the responses of sys and sys1 with the original estimation data z2.
compare(z2,sys,sys1)
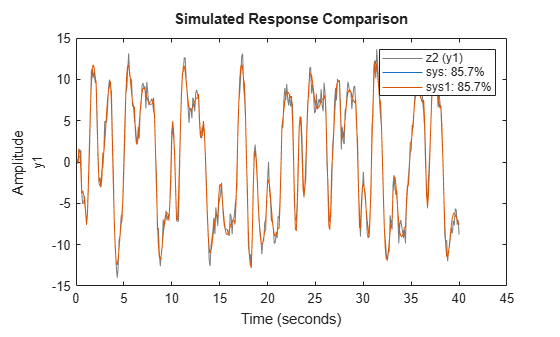
The model responses are identical.
Version History
Introduced before R2006a