dsp.SpectrumEstimator
Estimate power spectrum or power density spectrum
Description
The dsp.SpectrumEstimator
System object™ computes the power spectrum or the power density spectrum of a signal using the
Welch algorithm or the filter bank approach.
When you choose the Welch method, the object computes the averaged modified periodograms to compute the spectral estimate. When you choose the filter bank approach, an analysis filter bank splits the broadband input signal into multiple narrow subbands. The object computes the power in each narrow frequency band, and the computed value is the spectral estimate over the respective frequency band. For signals with relatively small FFT lengths, the filter bank approach produces a spectral estimate with a higher resolution, a more accurate noise floor, and peaks more precise than the Welch method, with low or no spectral leakage. These advantages come at the expense of increased computation and slower tracking.
The spectrum can be expressed in watts or in decibels. This object can also estimate the max-hold and min-hold spectra of the signal.
To estimate the power density spectrum:
Create the
dsp.SpectrumEstimatorobject and set its properties.Call the object with arguments, as if it were a function.
To learn more about how System objects work, see What Are System Objects?
Creation
Description
SE = dsp.SpectrumEstimatorSE, that computes the frequency power spectrum or the
power density spectrum of real or complex signals. This System object uses the Welch’s averaged modified periodogram method or the filter
bank-based spectral estimation method.
SE = dsp.SpectrumEstimator(PropertyName,Value)dsp.SpectrumEstimator
System object with each specified property name set to the specified value. Unspecified
properties have default values.
Properties
Usage
Description
Input Arguments
Output Arguments
Object Functions
To use an object function, specify the
System object as the first input argument. For
example, to release system resources of a System object named obj, use
this syntax:
release(obj)
Examples
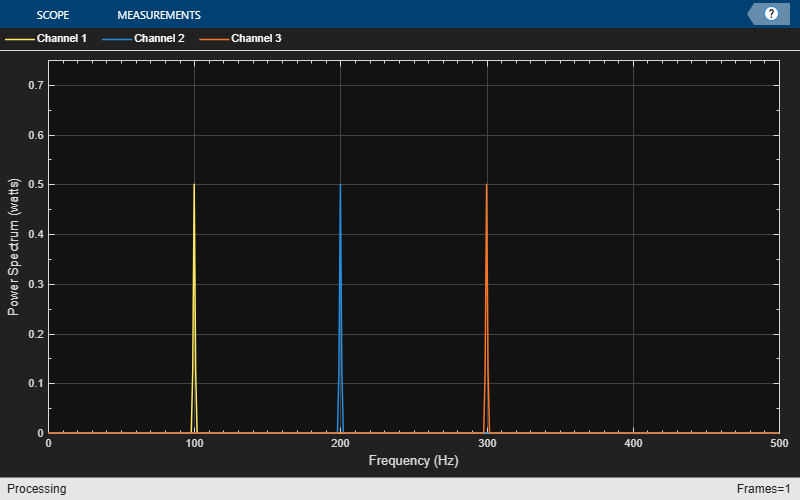
Compute the power spectrum of a multichannel sinusoidal signal using the dsp.SpectrumEstimator System object™. You can get the vector of frequencies at which the spectrum is estimated using the getFrequencyVector function. To compute the resolution bandwidth of the estimate (RBW), use the getRBW function.
Generate a three-channel sinusoid sampled at 1 kHz. Specify sinusoidal frequencies of 100, 200, and 300 Hz. The second and third channels have their phases offset from the first by  and
and  , respectively.
sineSignal = dsp.SineWave(SamplesPerFrame=1000,SampleRate=1000, ...
    Frequency=[100 200 300],PhaseOffset=[0 pi/2 pi/4]);
Estimate and plot the one-sided spectrum of the signal. Use the dsp.SpectrumEstimator object for the computation and the dsp.ArrayPlot for the plotting.
estimator = dsp.SpectrumEstimator(FrequencyRange="onesided");
plotter = dsp.ArrayPlot(PlotType="Line",YLimits=[0 0.75], ...
    YLabel="Power Spectrum (watts)",XLabel="Frequency (Hz)");
Step through to obtain the data streams and display the spectra of the three channels.
y = sineSignal();
pxx = estimator(y);
plotter(pxx)
Get the vector of frequencies at which the spectrum is estimated in Hz, using the getFrequencyVector function.
f = getFrequencyVector(estimator);
Compute the resolution bandwidth (RBW) of the estimate using the getRBW function.
getRBW(estimator)
ans =

    0.0015
The resolution bandwidth of the signal power spectrum is 0.0015 Hz. This frequency is the smallest frequency that can be resolved on the spectrum.
Compare spectral estimates of sinusoids embedded in white Gaussian noise using a Hann window-based Welch method and filter bank method.
Initialization
Initialize two dsp.SpectrumEstimator objects. Specify one estimator to use the Welch-based spectral estimation technique with a Hann window. Specify the other estimator to use an analysis filter bank to perform the spectral estimation. Specify a noisy sine wave input signal with 4 sinusoids at 0.16, 0.2, 0.205, and 0.25 cycles/sample. View the spectral estimate using an array plot.
FrameSize = 420;
Fs = 1;
sinegen = dsp.SineWave('SampleRate',Fs,...
    'SamplesPerFrame',FrameSize,...
    'Frequency',[0.16 0.2 0.205 0.25],...
    'Amplitude',[2e-5 1  0.05  0.5]);
NoiseVar = 1e-10;
numAvgs = 8;

hannEstimator = dsp.SpectrumEstimator('PowerUnits','dBm',...
    'Window','Hann','FrequencyRange','onesided',...
    'SpectralAverages',numAvgs,'SampleRate',Fs);

filterBankEstimator = dsp.SpectrumEstimator('PowerUnits','dBm',...
    'Method','Filter bank','FrequencyRange','onesided',...
    'SpectralAverages',numAvgs,'SampleRate',Fs);

spectrumPlotter = dsp.ArrayPlot(...
    'PlotType','Line','SampleIncrement',Fs/FrameSize,...
    'YLimits',[-250,50],'YLabel','dBm',...
    'ShowLegend',true,'ChannelNames',{'Hann window','Filter bank'});
Streaming
Stream the input. Compare the spectral estimates computed using the Hann window and the analysis filter bank
for i = 1:1000
    x = sum(sinegen(),2) + sqrt(NoiseVar)*randn(FrameSize,1);
    Pse_hann = hannEstimator(x);
    Pfb = filterBankEstimator(x);
    spectrumPlotter([Pse_hann,Pfb])
end
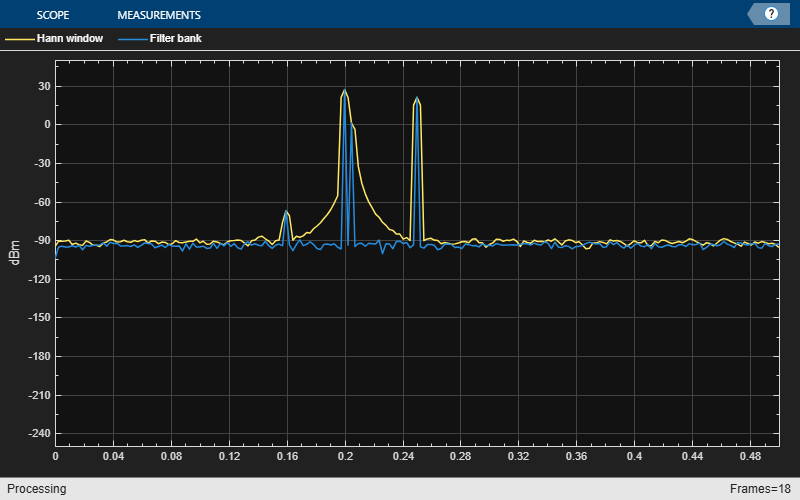
The Hann window misses the peak at 0.205 cycles/sample. In addition, the window has a significant spectral leakage that makes the peak at 0.16 cycles/sample hard to distinguish, and the noise floor is not correct.
The filter bank estimate has a very good resolution with no spectral leakage.
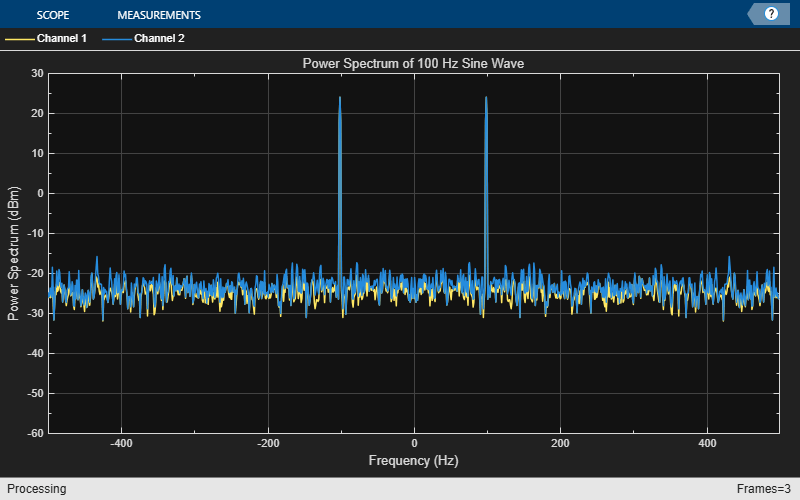
Generate a sine wave.
sineWave = dsp.SineWave(Frequency=100,...
    SampleRate=1000, ...
    SamplesPerFrame=1000);
Use the spectrum estimator to compute the power spectrum and the max-hold spectrum of the sine wave. Use the Array Plot to display the spectra.
SE = dsp.SpectrumEstimator(...
    SampleRate=sineWave.SampleRate,...
    SpectrumType="Power",PowerUnits="dBm", ...
    FrequencyRange="centered",...
    OutputMaxHoldSpectrum=true);
plotter = dsp.ArrayPlot(PlotType="Line",...
    XOffset=-500, ...
    YLimits=[-60 30],...
    Title="Power Spectrum of 100 Hz Sine Wave", ...
    YLabel="Power Spectrum (dBm)",...
    XLabel="Frequency (Hz)");
Add random noise to the sine wave. Stream in the data, and plot the power spectrum of the signal.
for ii = 1:10
    x = sineWave() + 0.05*randn(1000,1);
    [Pxx,Pmax] = SE(x);
    plotter([Pxx Pmax])
end
Algorithms
When you select the filter bank method, the spectrum estimator uses an analysis filter bank to estimate the power spectrum. The filter bank splits a broadband input signal, x(n), of sample rate fs into multiple narrow band signals, y0(m), y1(m), … , yM-1(m), of sample rate fs/M.
The variable M represents the number of frequency bands in the
filter bank. When you specify FFT length, M equals the FFT length.
When you do not specify FFT length, M is equal to the number of rows
in the input signal. The number of taps per frequency band sets the number of filter
coefficients for each frequency band of the filter bank. The total number of filter
coefficients is equal to the number of taps per band multiplied by the number of
frequency bands M. For more information on the analysis filter bank
and how it is implemented, see the More About and the Algorithm sections in
dsp.Channelizer.
After the broadband input signal is split into multiple narrow bands, the spectrum estimator computes the power in each narrow band using the following equation. Each Zi value becomes the estimate of the power over that narrow frequency band.
where L is the length of the narrow band signal yi(m) and i = 1, 2, …, M−1.
The power values in all the narrow bands (denoted by Zi) form the Z vector.
The filter bank estimator algorithm averages the current Z vector with the previous Z vectors using one of the two moving average methods: running or exponential weighting. The output of the averaging operation forms the spectral estimate vector. For more information on the two averaging methods, see Averaging Method.

The algorithm calculates the moving average using one of these methods:
Running— For each frame of input, average the last N-scaled Z vectors, which are computed by the algorithm. The variable N is the value you specify for the number of spectral averages. If the algorithm does not have enough Z vectors, the algorithm uses zeros to fill the empty elements.
Exponential— The moving average algorithm using the exponential weighting method updates the weights and computes the moving average recursively for each Z vector that comes in by using the following recursive equations:λ — Forgetting factor
— Weighting factor applied to the current Z vector
— Current Z vector
— Moving average until the previous Z vector
— Effect of the previous Z vectors on the average
— Moving average including the current Z vector
References
[1] Hayes, Monson H. Statistical Digital Signal Processing and Modeling. Hoboken, NJ: John Wiley & Sons, 1996
[2] Kay, Steven M. Modern Spectral Estimation: Theory and Application. Englewood Cliffs, NJ: Prentice Hall, 1999
[3] Stoica, Petre and Randolph L. Moses. Spectral Analysis of Signals. Upper Saddle River, NJ: Prentice Hall, 2005
[4] Welch, P. D. “The use of fast Fourier transforms for the estimation of power spectra: A method based on time averaging over short modified periodograms,” IEEE Transactions on Audio and Electroacoustics, Vol. 15, 1967, pp. 70–73.
[5] Harris, F.J. Multirate Signal Processing for Communication Systems. Prentice Hall. 2004, pp. 208–209.