Main Content

dsp.CrossSpectrumEstimator

Estimate cross-spectral density

Description

The dsp.CrossSpectrumEstimator System object™ computes the cross-spectrum density of a signal, using the Welch's averaged periodogram method.

To implement the cross-spectrum estimation object:

  1. Create the dsp.CrossSpectrumEstimator object and set its properties.

  2. Call the object with arguments, as if it were a function.

To learn more about how System objects work, see What Are System Objects?

Creation

Description

cse = dsp.CrossSpectrumEstimator returns a System object, cse, that computes the cross-power spectrum of real or complex signals using the periodogram method and Welch’s averaged, modified periodogram method.

example

cse = dsp.CrossSpectrumEstimator(Name,Value) returns a dsp.CrossSpectrumEstimator System object, cse, with each specified property name set to the specified value. Unspecified properties have default values.

Properties

expand all

Unless otherwise indicated, properties are nontunable, which means you cannot change their values after calling the object. Objects lock when you call them, and the release function unlocks them.

If a property is tunable, you can change its value at any time.

For more information on changing property values, see System Design in MATLAB Using System Objects.

Specify the source of the FFT length value as either 'Auto' or 'Property'. If you set this property to 'Auto', the cross-spectrum estimator sets the FFT length to the input frame size. If you set this property to 'Property', then specify the number of FFT points using the FFTLength property.

Specify the length of the FFT that the cross-spectrum estimator uses to compute cross-spectral estimates as a positive, integer scalar.

Dependencies

This property applies when you set the FFTLengthSource property to 'Property'.

Data Types: double

Specify a window function for the cross-spectrum estimator as one of 'Rectangular', 'Chebyshev', 'Flat Top', 'Hamming', 'Hann', or 'Kaiser'.

Specify the side lobe attenuation of the window as a real, positive scalar, in decibels (dB).

Dependencies

This property applies when you set the Window property to 'Chebyshev' or 'Kaiser'.

Data Types: double

Specify the frequency range of the cross-spectrum estimator as one of 'twosided', 'onesided', or 'centered'.

If you set the FrequencyRange to 'onesided', the cross-spectrum estimator computes the one-sided spectrum of real input signals, x and y. If the FFT length, NFFT, is even, the length of the cross-spectral estimate is NFFT/2+1 and is computed over the interval [0, SampleRate/2]. If NFFT is odd, the length of the cross-spectrum estimate is equal to (NFFT+1)/2, and the interval is [0, SampleRate/2].

If you set the FrequencyRange to 'twosided', the cross-spectrum estimator computes the two-sided spectrum of complex or real input signals, x and y. The length of the cross-spectrum estimate is equal to NFFT. This value is computed over [0, SampleRate].

If you set the FrequencyRange to 'centered', the cross-spectrum estimator computes the centered two-sided spectrum of complex or real input signals, x and y. The length of the cross-spectrum estimate is equal to NFFT, and the estimate is computed between [-SampleRate/2, SampleRate/2] and (-SampleRate/2, SampleRate/2) for even and odd lengths, respectively.

Specify the averaging method as 'Running' or 'Exponential'. In the running averaging method, the object computes an equally weighted average of a specified number of spectrum estimates defined by the SpectralAverages property. In the exponential method, the object computes the average over samples weighted by an exponentially decaying forgetting factor.

Specify the number of spectral averages as a positive, integer scalar. The object computes the current cross-spectral estimate by averaging the last N estimates. N is the number of spectral averages defined in the SpectralAverages property.

Dependencies

This property applies when you set AveragingMethod to 'Running'.

Data Types: double

Specify the exponential weighting forgetting factor as a scalar value greater than zero and smaller than or equal to one.

Tunable: Yes

Dependencies

This property applies when you set AveragingMethod to 'Exponential'.

Data Types: single | double

Specify the sample rate of the input, in hertz, as a finite numeric scalar. The sample rate is the rate at which the signal is sampled in time.

Data Types: single | double

Usage

Description

example

pxy = cse(x,y) computes the cross power spectrum density, pxy, of the input signals, x and y.

Input Arguments

expand all

First data input, specified as a vector or a matrix. The inputs, x and y must have the same size and data type.

Data Types: single | double
Complex Number Support: Yes

Second data input, specified as a vector or a matrix. The inputs, x and y must have the same size and data type.

Data Types: single | double
Complex Number Support: Yes

Output Arguments

expand all

Cross-power spectrum density output, returned as a vector or a matrix. The output has the same size and data type as the input signals.

Data Types: single | double
Complex Number Support: Yes

Object Functions

To use an object function, specify the System object as the first input argument. For example, to release system resources of a System object named obj, use this syntax:

release(obj)

expand all

getFrequencyVectorVector of frequencies at which estimation is done
getRBWResolution bandwidth of spectrum
stepRun System object algorithm
releaseRelease resources and allow changes to System object property values and input characteristics
resetReset internal states of System object

Examples

collapse all

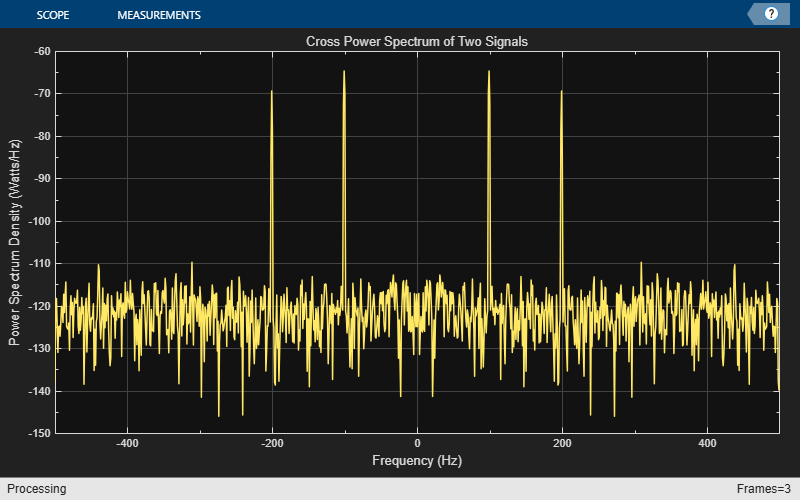
Generate two sine waves.

sin1 = dsp.SineWave('Frequency',200, 'SampleRate', 1000);
sin1.SamplesPerFrame = 1000;
sin2 = dsp.SineWave('Frequency',100, 'SampleRate', 1000);
sin2.SamplesPerFrame =  1000;

Use the dsp.CrossSpectrumEstimator System object™ to compute the cross-spectrum of the signals. Also, use the dsp.ArrayPlot object to display the spectra.

cse = dsp.CrossSpectrumEstimator('SampleRate', sin1.SampleRate,...
    'FrequencyRange','centered');
aplot = dsp.ArrayPlot('PlotType','Line','XOffset',-500,'YLimits',...
    [-150 -60],'YLabel','Power Spectrum Density (Watts/Hz)',...
    'XLabel','Frequency (Hz)',...
    'Title','Cross Power Spectrum of Two Signals');

Add random noise to the sine waves. Stream in the data, and plot the cross-power spectrum of the two signals.

for ii = 1:10
x = sin1() + 0.05*randn(1000,1);
y = sin2() + 0.05*randn(1000,1);
Pxy = cse(x, y);
aplot(20*log10(abs(Pxy)));
end

Algorithms

expand all

References

[1] Hayes, Monson H. Statistical Digital Signal Processing and Modeling. Hoboken, NJ: John Wiley & Sons, 1996.

[2] Kay, Steven M. Modern Spectral Estimation: Theory and Application. Englewood Cliffs, NJ: Prentice Hall, 1999.

[3] Stoica, Petre, and Randolph L. Moses. Spectral Analysis of Signals. Englewood Cliffs, NJ: Prentice Hall, 2005.

[4] Welch, P. D. ''The Use of Fast Fourier Transform for the Estimation of Power Spectra: A Method Based on Time Averaging Over Short Modified Periodograms.'' IEEE Transactions on Audio and Electroacoustics. Vol. 15, No. 2, June 1967, pp. 70–73.

Extended Capabilities

Version History

Introduced in R2013b