Visualize Logged Data from Unreal Engine Simulation
This example shows how to customize the visualization of logged simulation data in a time-synchronized fashion by using the Simulation Data Inspector (SDI).
Introduction
Automated driving applications use multilevel sensors such as cameras, radars, and lidar sensors to implement perception, planning, and control algorithms. Automated Driving Toolbox™ provides tools for creating and visualizing different test scenarios to test and verify the behavior of your application. Improving the design of an application often requires visualizing data from different sensors, along with simulation data, to analyze and debug failed test cases.
This example shows how to customize the visualization of logged simulation data for post-simulation analysis of an automated driving application. It shows how to configure and visualize the logged sensor and simulation data in a time-synchronized fashion using SDI. In this example, you:
Explore and simulate test bench model — The model consists of vehicles, an environment, and a visualization framework. Configure and simulate the model to log the data for post-simulation analysis.
Inspect logged data — Explore and inspect the logged data.
Configure and visualize a data instance — Configure and visualize the logged data at a specific time instance.
Visualize logged data using SDI — Visualize the logged data for the entire simulation run using SDI.
Because this example requires a photorealistic simulation environment to capture data from various sensors during simulation, you enable the simulation through integration with the Unreal Engine® from Epic Games®. This example requires a Windows® 64-bit platform. This example requires a machine with at least 4 GB of VRAM.
if ~ispc
    error(['This example is supported only on Microsoft', char(174),' Windows 64-bit platform.'])
end
This example uses Virtual Mcity scene for simulation. You must install the scene using the Add-On Installer dialog box from the Simulation 3D Scene Configuration block. For more information on setting up Virtual Mcity scene for simulation, see Virtual Mcity.
Explore and Simulate Test Bench Model
In this example, you use a test bench model to log the data during the simulation. In this test bench, the ego car moves around the Virtual Mcity scene, and the model visualizes the sensor data.
Open the test bench model.
open_system("VisualizeSensorDataTestBench")
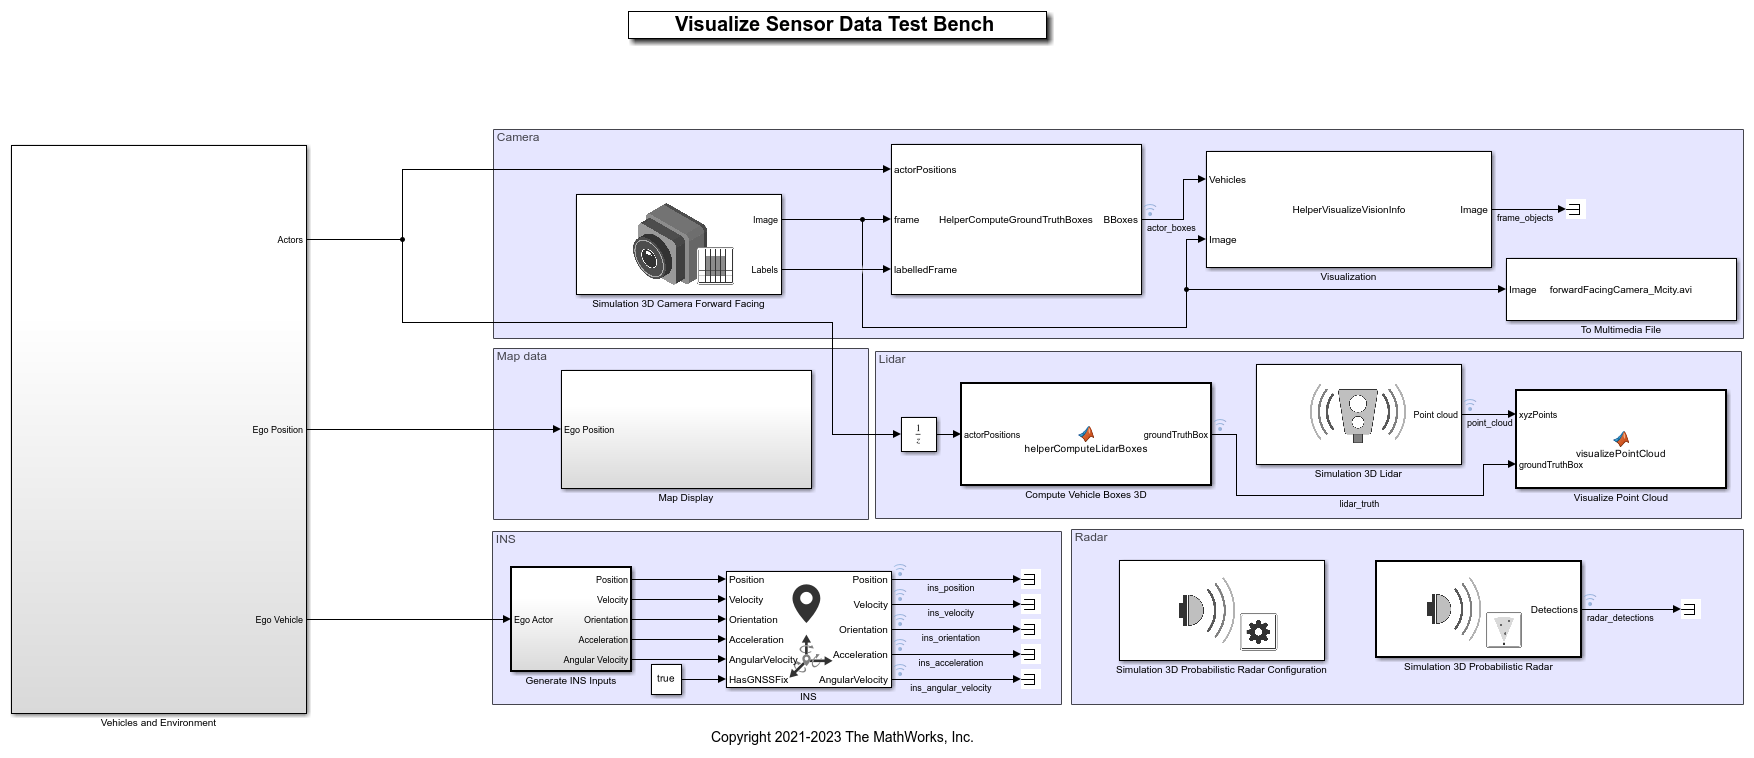
The test bench model contains these subsystems:
Vehicles and Environment— Specifies the scene and vehicles.Camera— Specifies a camera sensor, overlays bounding boxes for vehicles in the scene, and logs the data to a multimedia file.Map data— Generates latitude and longitude from the ego position, and plots geographic data usinggeoplayer.Lidar— Specifies a lidar sensor, computes bounding boxes for vehicles, and visualizes point cloud data.INS— Specifies an INS sensor to get pose information for the ego vehicle.Radar— Specifies a radar sensor to obtain radar detections.
The Vehicles and Environment subsystem uses the prebuilt Virtual Mcity scene with predefined vehicle trajectories. Open the Vehicles and Environment subsystem.
open_system("VisualizeSensorDataTestBench/Vehicles and Environment")

The scenario contains six vehicles moving with predefined trajectories. The ego vehicle is connected to the camera, radar, and lidar sensors. This example enables you to visualize the data of these sensors and the ground truth of the vehicles.
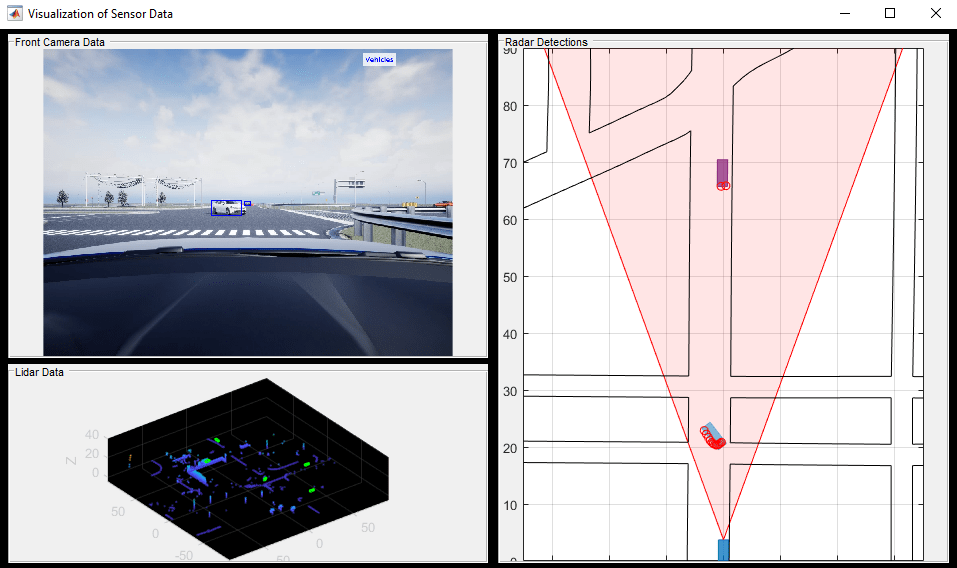
You can also configure logging of the required data and signals for post-simulation visualization. For more information, see Mark Signals for Logging (Simulink). When you run the simulation, the model opens different windows to visualize different types of data:
Unreal Engine creates a 3D simulation window to display the scenario.
The To Video Display block displays the images overlaid with ground truth vehicles.
The
Map Displaysubsystem opens a geographic player to display the geographic location of the ego vehicle.The
Visualize Point CloudMATLAB® function block opens a lidarpcplayerwindow to display the point cloud.
Simulate the model to log the required data.
sim("VisualizeSensorDataTestBench");
close("PointCloud data")

Inspect Logged Data
For post-simulation visualization, the model logs the simulation data to the logsout variable, which is a Simulink.SimulationData.Dataset (Simulink)Simulink.SimulationData.Signal (Simulink)
Display logsout.
disp(logsout)
Simulink.SimulationData.Dataset 'logsout' with 15 elements

                         Name                  BlockPath
                         ____________________  ________________________________________
    1  [1x1 Signal]      lidar_truth           ...ataTestBench/Compute Vehicle Boxes 3D
    2  [1x1 Signal]      ins_acceleration      VisualizeSensorDataTestBench/INS
    3  [1x1 Signal]      ins_angular_velocity  VisualizeSensorDataTestBench/INS
    4  [1x1 Signal]      ins_orientation       VisualizeSensorDataTestBench/INS
    5  [1x1 Signal]      ins_position          VisualizeSensorDataTestBench/INS
    6  [1x1 Signal]      ins_velocity          VisualizeSensorDataTestBench/INS
    7  [1x1 Signal]      actor_boxes           ...izeSensorDataTestBench/MATLAB System1
    8  [1x1 Signal]      ego_latitude          ...ataTestBench/Map Display/Conv2LatLong
    9  [1x1 Signal]      ego_longitude         ...ataTestBench/Map Display/Conv2LatLong
   10  [1x1 Signal]      point_cloud           ...nsorDataTestBench/Simulation 3D Lidar
   11  [1x1 Signal]      ''                    ...mulation 3D Lidar/Simulation 3D Lidar
   12  [1x1 Signal]      radar_detections      ...nch/Simulation 3D Probabilistic Radar
   13  [1x1 Signal]      ''                    ...dar/Simulation 3D Probabilistic Radar
   14  [1x1 Signal]      actors                ...icles and Environment/Scenario Reader
   15  [1x1 Signal]      ego                   ...icles and Environment/Scenario Reader

  - Use braces { } to access, modify, or add elements using index.
You can access a logged signal using its Name or BlockPath by using the get method. For example, access the signal for the logged radar detections using this command.
radarSignal = logsout.get("radar_detections")
radarSignal =

  Simulink.SimulationData.Signal
  Package: Simulink.SimulationData

  Properties:
              Name: 'radar_detections'
    PropagatedName: ''
         BlockPath: [1×1 Simulink.SimulationData.BlockPath]
          PortType: 'outport'
         PortIndex: 1
            Values: [1×1 struct]
To access the data from the signal, use the Values property of the Simulink.SimulationData.Signal object. Get the data of the radar signal.
radarData = radarSignal.Values
radarData =

  struct with fields:

    NumDetections: [1×1 timeseries]
      IsValidTime: [1×1 timeseries]
       Detections: [50×1 struct]
Notice that the NumDetections field is in timeseries format. It contains data for the complete simulation run in array format. Display the NumDetections data.
disp(radarData.NumDetections)
  timeseries with properties:

               Events: []
                 Name: 'NumDetections'
             UserData: []
                 Data: [1×1×1121 double]
             DataInfo: [1×1 tsdata.datametadata]
                 Time: [1121×1 double]
             TimeInfo: [1×1 tsdata.timemetadata]
              Quality: []
          QualityInfo: [1×1 tsdata.qualmetadata]
          IsTimeFirst: 0
    TreatNaNasMissing: 1
               Length: 1121
The Time property contains the corresponding time for each logged signal. The Data property contains the number of detections at each time step.
Find the number of detections, and the corresponding simulation time, of the data point 481.
disp(['At ',num2str(radarData.NumDetections.Time(481)), ...
    's, the Number of Radar Detections is ', num2str(radarData.NumDetections.Data(481)), '.'])
At 24s, the Number of Radar Detections is 32.
Configure and Visualize Data Instance
This section shows how to configure the setup script to visualize the logged data at a specified time.
Configure Visualization Parameters
Use the helperVisualizationSetup function to customize the visualization of your sensors.
The helperVisualizationSetup function returns a visualization configuration structure that can store the required sensor data for visualization along with flags indicating whether or not to visualize cameras, radar sensors, and lidar sensors. By default, the configuration structure has zeroes for sensor data.
In this example, the data visualization flags are preset to visualize the camera image with vehicle truth 2D bounding boxes, radar detections with actor truth, and lidar point clouds with vehicle truth 3D bounding boxes.
visualizationDataConfig = helperVisualizationSetup
visualizationDataConfig =

  struct with fields:

    enableCameraVisualization: 1
     enableRadarVisualization: 1
     enableLidarVisualization: 1
                    numCamera: 1
                     numRadar: 1
                     numLidar: 1
                BusCameraData: [1×1 struct]
                 BusRadarData: [1×1 struct]
                 BusLidarData: [1×1 struct]
Note that the flags are set to visualize data from the camera, radar, and lidar sensors. The data of each sensor is stored in an individual structure. You can use the Type Editor to understand the format of the sensor data. For more information, see Type Editor (Simulink).
The BusCameraData structure stores flags to enable visualization of ground truth and detections along with the data.
disp(visualizationDataConfig.BusCameraData)
           enableCameraLaneTruth: 0
         enableCameraObjectTruth: 1
      enableCameraLaneDetections: 0
    enableCameraObjectDetections: 0
                           Frame: [768×1024×3 double]
                     GroundTruth: [1×1 struct]
                      Detections: [1×1 struct]
                      Parameters: [1×1 struct]
The flag to visualize vehicle bounding boxes overlaid on camera image is set to true. Other flags for lane visualizations (truth and detections) and vehicle detections are set to false.
The Frame field stores image data for visualization as an array. The GroundTruth structure stores ground truth data for vehicles and lanes.
disp(visualizationDataConfig.BusCameraData.GroundTruth)
    Objects: [20×4 double]
      Lanes: [1×1 struct]
The Detections structure stores detections from vehicles and lanes.
disp(visualizationDataConfig.BusCameraData.Detections)
    Objects: [1×1 struct]
      Lanes: [1×1 struct]
The Parameters structure stores camera parameters, which can be changed by editing the helperVisualizationSetup function script.
disp(visualizationDataConfig.BusCameraData.Parameters)
             NumColumns: 1024
                NumRows: 768
            FieldOfView: [45 45]
              ImageSize: [768 1024]
         PrincipalPoint: [512 384]
            FocalLength: [512 512]
               Position: [1.8750 0 1.2000]
          PositionSim3d: [0.5700 0 1.2000]
               Rotation: [0 0 0]
        DetectionRanges: [6 50]
    LaneDetectionRanges: [6 30]
       MeasurementNoise: [3×3 double]
     MinObjectImageSize: [10 10]
The BusRadarData structure stores flags to enable visualization of actor truth and of the scenario overlaid on a bird's-eye view. By default, these two flags are set to true. This structure also stores the actor ground truth, radar detections, and radar parameters. You can modify radar parameters using the helperVisualizationSetup function.
disp(visualizationDataConfig.BusRadarData)
         enableRadarObjectTruth: 1
    enableScenarioVisualization: 1
                         Actors: [1×1 struct]
                     Detections: [1×1 struct]
                     Parameters: [1×1 struct]
disp(visualizationDataConfig.BusRadarData.Parameters)
        FieldOfView: [40 5]
    DetectionRanges: [1 150]
           Position: [3.7290 0 0.8000]
      PositionSim3d: [2.4240 0 0.8000]
           Rotation: [0 0 0]
The BusLidarData stores the enableLidarObjectTruth flag, which enables the visualization of ground truth vehicle bounding boxes on the point cloud. To store ground truth information, set this flag to true. The PointCloud field stores the point cloud data for visualization.
disp(visualizationDataConfig.BusLidarData)
    enableLidarObjectTruth: 1
               ObjectTruth: [20×9 double]
                PointCloud: [0 0 0]
Get Data Instance
Use the visualizationDataConfig structure to visualize data at a specified time instance. Visualize the sensor data at 24 seconds, extract the data from logsout, and store it in the configuration structure.
Specify a time for visualization.
time = 24;
simulationTimeStep = max(1,round(time/Ts)); % Ts is simulation step size.
Read the camera data and vehicle truth 2D bounding boxes from logsout.
% Read camera image recording
videoSrc = VideoReader("forwardFacingCamera_Mcity.avi");

% Vehicle ground truth 2D bounding boxes
cameraObjectTruthData = logsout.get("actor_boxes").Values;
Get the camera frame at the specified time.
frame = read(videoSrc, simulationTimeStep);
Add the camera frame and vehicle truth to the visualizationDataConfig structure.
% Add camera frame into structure
visualizationDataConfig.BusCameraData.Frame = frame;
% Add vehicle truth 2D bounding boxes into structure
visualizationDataConfig.BusCameraData.GroundTruth.Objects = cameraObjectTruthData.data(:,:,simulationTimeStep);
Read the radar detections, ego bus, and vehicle truth.
radarDetectionsData = logsout.get("radar_detections").Values;
egoVehicleData = logsout.get("ego").Values;
radarActorTruth = logsout.get("actors").Values;
Add the radar detections to the visualizationDataConfig structure.
% Radar object detections
numDetections = radarDetectionsData.NumDetections.Data(simulationTimeStep);
for k = 1:numDetections
    visualizationDataConfig.BusRadarData.Detections.Detections(k).Measurement = radarDetectionsData.Detections(k).Measurement.Data(:,:,simulationTimeStep);
    visualizationDataConfig.BusRadarData.Detections.Detections(k).MeasurementNoise = radarDetectionsData.Detections(k).MeasurementNoise.Data(:,:,simulationTimeStep);
end
visualizationDataConfig.BusRadarData.Detections.NumDetections = numDetections;
Add ego information to visualizationDataConfig for visualizing the scenario in a bird's-eye plot.
% Ego information
visualizationDataConfig.BusRadarData.Actors.NumActors = 1;
visualizationDataConfig.BusRadarData.Actors.Actors(1).Position = egoVehicleData.Position.Data(:,:,simulationTimeStep);
visualizationDataConfig.BusRadarData.Actors.Actors(1).Yaw = egoVehicleData.Yaw.Data(:,:,simulationTimeStep);
Add actor truth to the visualizationDataConfig structure for visualization in a bird's-eye plot.
% Get actor truth for radar
numActors = radarActorTruth.NumActors.Data(simulationTimeStep);
% Add Actor bus data into structure
visualizationDataConfig.BusRadarData.Actors.NumActors = radarActorTruth.NumActors.Data(simulationTimeStep) + 1;
fn = fieldnames(visualizationDataConfig.BusRadarData.Actors.Actors);
for i = 1:numActors
    for k = 1:numel(fn)
        visualizationDataConfig.BusRadarData.Actors.Actors(i+1).(fn{k}) = radarActorTruth.Actors(i).(fn{k}).Data(:,:,simulationTimeStep);
    end
end
Read the lidar data and vehicle truth 3D bounding boxes from the simulation data.
% Lidar data
pointCloudData = logsout.get("point_cloud").Values;
% Vehicle ground truth 3D bounding boxes
lidarActorBoxes = logsout.get("lidar_truth").Values;
Add the lidar data and vehicle truth to the visualizationDataConfig structure.
% Add point cloud into structure
visualizationDataConfig.BusLidarData.PointCloud = pointCloudData.Data(:,:,:,simulationTimeStep);
% Add vehicle truth 3D bounding boxes into structure
visualizationDataConfig.BusLidarData.ObjectTruth = lidarActorBoxes.Data(:,:,simulationTimeStep);
Visualize Data Instance
Use the helperPlotSensorData function to visualize the data in visualizationDataConfig. Because this function uses persistent variables to define the figure and axes for visualization, you must clear the existing persistent variables.
clear helperPlotSensorData
Visualize the data instance.
helperPlotSensorData(visualizationDataConfig, scenario)
Visualize Logged Data using SDI
You can also use SDI to visualize the logged data for an entire simulation. SDI is a powerful tool for visualizing and comparing multiple kinds of data, including map data. Using SDI, you can visualize logged signals during and after the simulation. You can use the cursor in SDI to visualize the data in playback mode. You can also assign a callback function to the cursor, using the Simulink.sdi.registerCursorCallback function, that triggers when you move the SDI cursor. Because the Simulink.sdi.registerCursorCallback function returns a callback ID that you must clear before assigning another callback function, use the Simulink.sdi.unregisterCursorCallback function to clear the SDI callback.

This flowchart shows the workflow for visualizing logged data using SDI. Using the helperVisualizeData function, you can specify the names of the signals that logged data during simulation. You can also visualize map data with the logged ego_latitude and ego_longitude signals. For more information, see View and Replay Map Data (Simulink).
The helperVisualizeData function initializes SDI, and adds the seekSDICallbackFunction function as the SDI cursor callback function. The callback function takes the data from logsout and adds it to the structure at each cursor move. The callback function passes this structure to the helperPlotSensorData function, which enables you to visualize sensor data in playback mode.
visualizationDataConfig = helperVisualizationSetup;
id = helperVisualizeData(logsout, scenario, visualizationDataConfig);

The helperVisualizeData function returns the callback ID of the SDI cursor callback function. Unregister the SDI cursor callback function before running the simulation again.
Simulink.sdi.unregisterCursorCallback(id)