Main Content

plot

Plot lane boundary points

Since R2024a

Description

example

plot(laneBoundaries) plots all the lane boundary points in the input laneBoundarySegment, or laneBoundaryGroup object laneBoundaries.

plot(laneBoundaries,Name=Value) specifies options using one or more name-value arguments. For example, LaneBoundaryIDs=laneBoundaryIDs plots only the lane boundary points that belong to the specified lane boundary IDs laneBoundaryIDs.

axesHandle = plot(___) returns a figure handle as an axes object.

Note

This function requires the Scenario Builder for Automated Driving Toolbox™ support package. You can install the Scenario Builder for Automated Driving Toolbox support package from the Add-On Explorer. For more information about installing add-ons, see Get and Manage Add-Ons.

Examples

collapse all

Load lane boundary segment data into the workspace.

data = load("laneBoundarySegmentData.mat","lbsegment");

Display the lane boundary segment object.

data.lbsegment
ans = 
  laneBoundarySegment with properties:

       BoundaryIDs: [4×1 string]
    BoundaryPoints: {4×1 cell}
      BoundaryInfo: []
     NumBoundaries: 4
         NumPoints: 128
      GeoReference: []

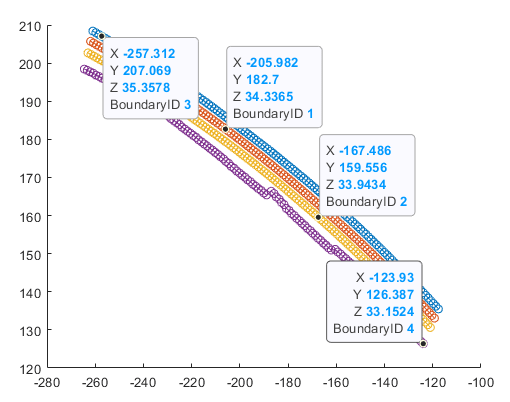
Plot all lane boundary points in the loaded lane boundary segment object.

plot(data.lbsegment)

Select a lane boundary point in the figure and observe its relevant information, such as boundary ID.

Load lane boundary data into the workspace

data = load("laneBoundaryGroupData.mat","lbGroup");

Display the lane boundary group object.

lbGroup = data.lbGroup
lbGroup = 
  laneBoundaryGroup with properties:

      BoundarySegments: [2×1 laneBoundarySegment]
    SegmentConnections: {[1 2]  [4×2 string]}
        BoundaryGroups: [1×5 struct]
          GeoReference: []

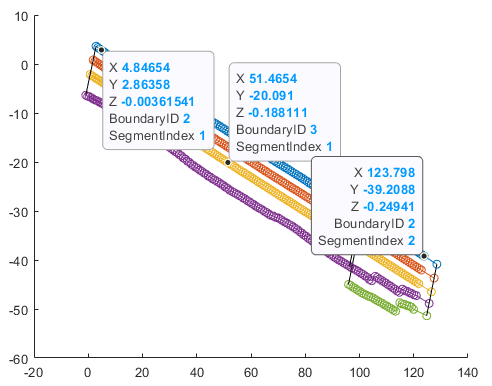
Plot all lane boundary points in the loaded lane boundary group object.

plot(lbGroup)

Select a lane boundary point in the figure and observe its relevant information, such as boundary ID and segment index.

Input Arguments

collapse all

Lane boundaries, specified as a laneBoundarySegment or laneBoundaryGroup object.

Name-Value Arguments

Specify optional pairs of arguments as Name1=Value1,...,NameN=ValueN, where Name is the argument name and Value is the corresponding value. Name-value arguments must appear after other arguments, but the order of the pairs does not matter.

Example: plot(laneBoundaryPoints,LaneBoundaryIDs=laneBoundaryIDs) plots only the lane boundary points that belong to the specified lane boundary IDs laneBoundaryIDs.

Lane boundary IDs, specified as an N-by-1 string array. N is the number of lane boundaries.

Data Types: string

Parent figure, specified as an Axes object. If you specify this argument, the function plots the lane boundaries in an existing figure. Otherwise, the function creates a new figure and plots the lane boundaries in it.

You can return an Axes object when calling a plot function. For example, axesHandle = plot(laneBoundaries) creates an Axes object, axesHandle.

Data Types: string

Output Arguments

collapse all

Figure handle, returned as an Axes object.

Version History

Introduced in R2024a