laneMarkingVertices
Lane marking vertices and faces in driving scenario
Description
[
returns the lane marking vertices, lmv,lmf] = laneMarkingVertices(scenario)lmv, and lane marking faces,
lmf, contained in driving scenario scenario.
The lmf and lmv outputs are in the world
coordinates of scenario. Use lane marking vertices and faces to
display lane markings using the laneMarkingPlotter function with a bird's-eye plot.
Examples
Create a driving scenario containing a car and pedestrian on a straight road. Then, create and display the lane markings of the road on a bird's-eye plot.
Create an empty driving scenario.
scenario = drivingScenario;
Create a straight, 25-meter road segment with two travel lanes in one direction.
lm = [laneMarking('Solid')
      laneMarking('Dashed','Length',2,'Space',4)
      laneMarking('Solid')];
l = lanespec(2,'Marking',lm);
road(scenario,[0 0 0; 25 0 0],'Lanes',l);
Add to the driving scenario a pedestrian crossing the road at 1 meter per second and a car following the road at 10 meters per second.
ped = actor(scenario,'ClassID',4,'Length',0.2,'Width',0.4,'Height',1.7);
car = vehicle(scenario,'ClassID',1);
smoothTrajectory(ped,[15 -3 0; 15 3 0],1);
smoothTrajectory(car,[car.RearOverhang 0 0; 25-car.Length+car.RearOverhang 0 0],10);
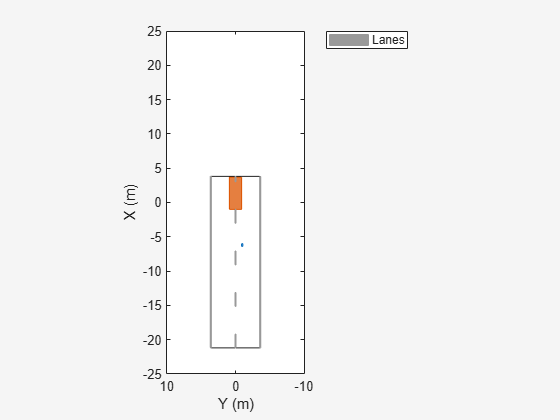
Display the scenario and corresponding chase plot.
plot(scenario)
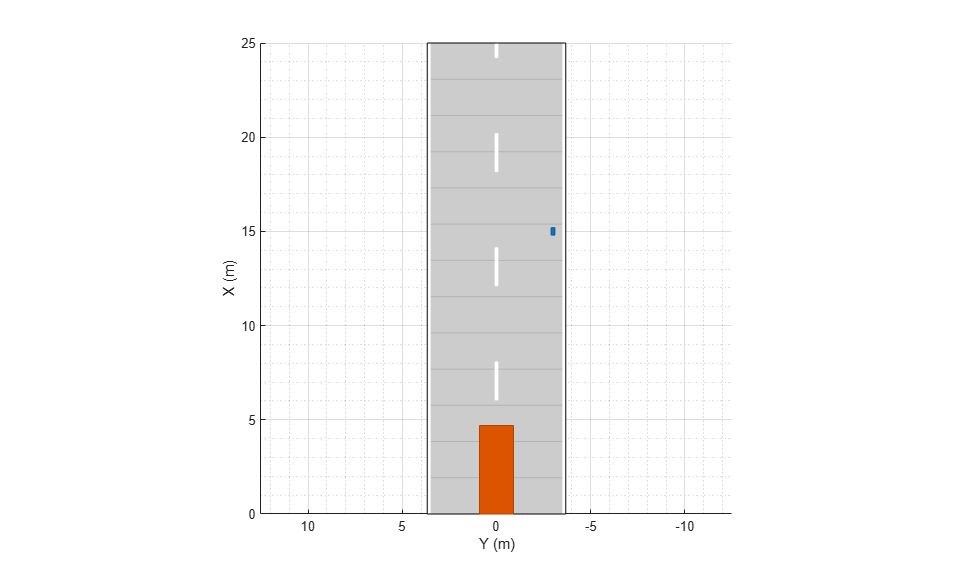
chasePlot(car)
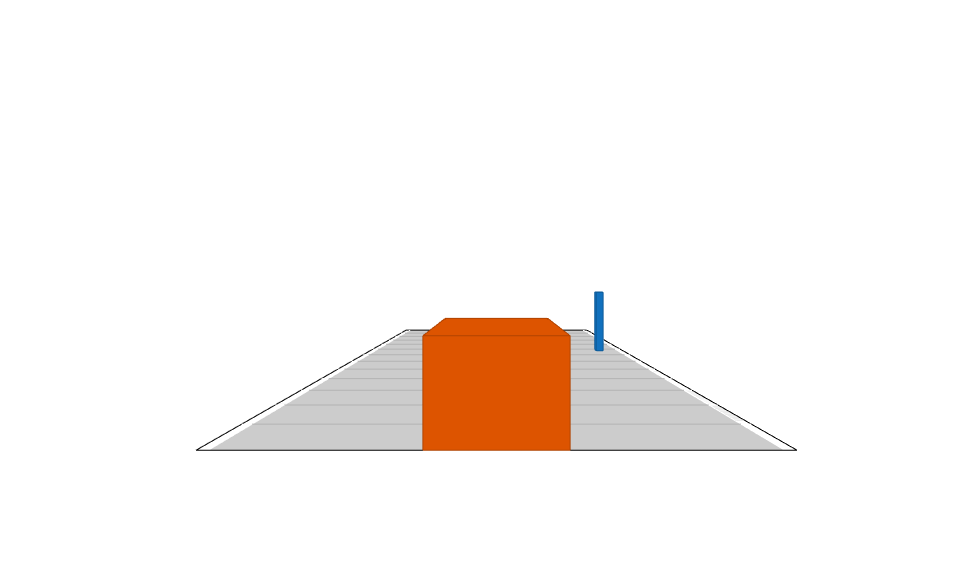
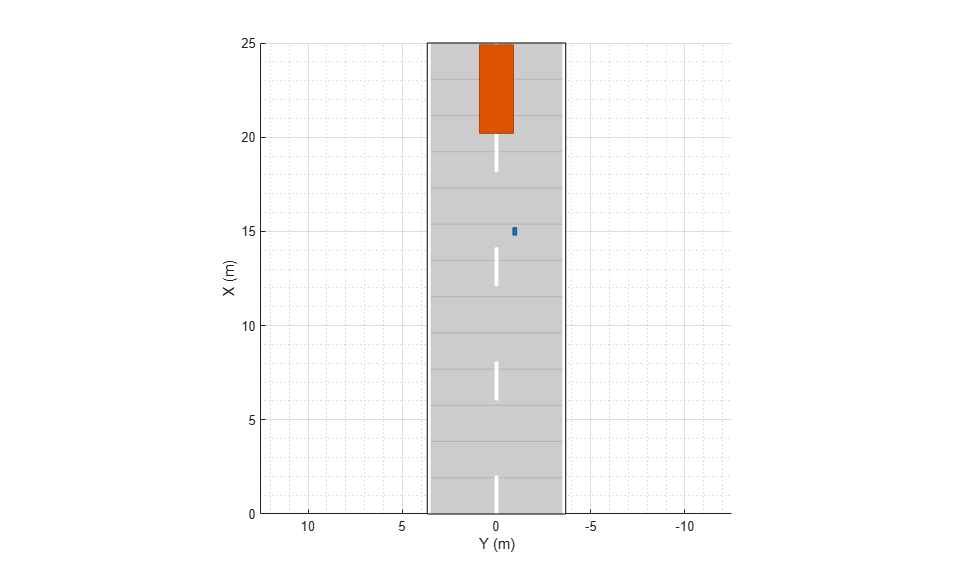
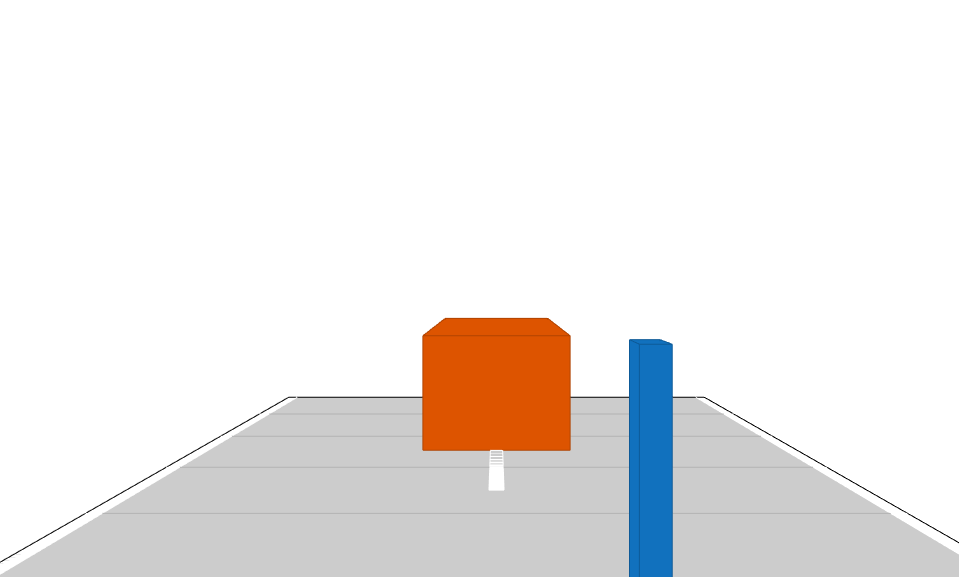
Run the simulation.
Create a bird's-eye plot.
Create an outline plotter, lane boundary plotter, and lane marking plotter for the bird's-eye plot.
Obtain the road boundaries and target outlines.
Obtain the lane marking vertices and faces.
Display the lane boundaries and lane markers.
Run the simulation loop.
bep = birdsEyePlot('XLim',[-25 25],'YLim',[-10 10]);
olPlotter = outlinePlotter(bep);
lbPlotter = laneBoundaryPlotter(bep);
lmPlotter = laneMarkingPlotter(bep,'DisplayName','Lanes');
legend('off');
while advance(scenario)
    rb = roadBoundaries(car);
    [position,yaw,length,width,originOffset,color] = targetOutlines(car);
    [lmv,lmf] = laneMarkingVertices(car);
    plotLaneBoundary(lbPlotter,rb);
    plotLaneMarking(lmPlotter,lmv,lmf);
    plotOutline(olPlotter,position,yaw,length,width, ...
        'OriginOffset',originOffset,'Color',color);
end
Input Arguments
Output Arguments
Algorithms
This function uses the patch function to define lane marking
vertices and faces.
Version History
Introduced in R2018a