Skip to content
MathWorks - Mobile View
  • MathWorks 계정에 로그인합니다.MathWorks 계정에 로그인합니다.
  • Access your MathWorks Account
    • 내 계정
    • 나의 커뮤니티 프로필
    • 라이선스를 계정에 연결
    • 로그아웃
  • 제품
  • 솔루션
  • 아카데미아
  • 지원
  • 커뮤니티
  • 이벤트
  • MATLAB 받기
MathWorks
  • 제품
  • 솔루션
  • 아카데미아
  • 지원
  • 커뮤니티
  • 이벤트
  • MATLAB 받기
  • MathWorks 계정에 로그인합니다.MathWorks 계정에 로그인합니다.
  • Access your MathWorks Account
    • 내 계정
    • 나의 커뮤니티 프로필
    • 라이선스를 계정에 연결
    • 로그아웃

비디오 및 웨비나

  • MathWorks
  • 비디오
  • 비디오 홈
  • 검색
  • 비디오 홈
  • 검색
  • 영업 담당 문의
  • 평가판 신청
1:45 Video length is 1:45.
  • Description
  • Full Transcript
  • Related Resources

How to Customize Histograms in MATLAB

Learn how to leverage simple MATLAB® functions to customize the appearance of a histogram. You’ll learn how to accomplish tasks like changing the bin size and displaying relative frequencies on the y-axis instead of absolute counts.

This video demonstrates how to leverage simple MATLAB functions to customize the appearance of a histogram. You’ll learn how to accomplish tasks like changing the bin size and displaying relative frequencies on the y-axis instead of absolute counts.

In the first section, we generate 10,000 random numbers of standard normal distribution. The histogram function helps us visualize this data using default settings.

We can implement some useful customizations by passing additional parameters to the function. If we want to group our data into larger buckets, we simply pass in an array that specifies the bin edges; in this case, we’ll get bins of width 0.5 from -4 to 4.

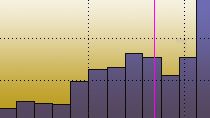
Furthermore, we can change the histogram to display relative frequencies instead of absolute counts. How much of this data is concentrated in this highest bin? Hard to tell, but if we run the function with these parameters, we quickly see the answer is about 20%.

Finally, to give us more control on how our histogram is visualized, we’ll convert the histogram into a bar graph. We simply replace “histogram” with “histcounts” to get the count in each bin, and the bin edges. Note that we only need to supply the “count” variable to the bar function to reproduce the shape of the histogram. If we care about the x-axis matching up exactly with our previous histogram, we can use this code.

Now that we’re working with a bar graph, we can quickly apply useful customizations. First, we’ll modify the y-axis ticks to display percentages, and adjust the count to match. And as with any good graph, we should add a title, and label the axes.

To learn more about histograms and other customizations for MATLAB graphs, check out the links in the description.

Learn about bar function
Add formatting and annotation
Add titles and labels

Bridging Wireless Communications Design and Testing with MATLAB

Read white paper
Related Information
Related Information
Learn about histogram function

Feedback

Up Next:

31:29
MATLAB: Tips and Tricks

Related Videos:

39:07
MATLAB Meets MINDSTORMS: How to Control LEGO NXT Robots...
4:15
How to Label a Series of Points on a Plot in MATLAB
23:51
How Weather and Pricing Affect Sales: Using MATLAB to...
30:55
How Fennia Life Models Insurance Risk for Solvency II,...
MathWorks - Domain Selector

Select a Web Site

Choose a web site to get translated content where available and see local events and offers. Based on your location, we recommend that you select: .

  • Switzerland (English)
  • Switzerland (Deutsch)
  • Switzerland (Français)
  • 中国 (简体中文)
  • 中国 (English)

You can also select a web site from the following list:

How to Get Best Site Performance

Select the China site (in Chinese or English) for best site performance. Other MathWorks country sites are not optimized for visits from your location.

Americas

  • América Latina (Español)
  • Canada (English)
  • United States (English)

Europe

  • Belgium (English)
  • Denmark (English)
  • Deutschland (Deutsch)
  • España (Español)
  • Finland (English)
  • France (Français)
  • Ireland (English)
  • Italia (Italiano)
  • Luxembourg (English)
  • Netherlands (English)
  • Norway (English)
  • Österreich (Deutsch)
  • Portugal (English)
  • Sweden (English)
  • Switzerland
    • Deutsch
    • English
    • Français
  • United Kingdom (English)

Asia Pacific

  • Australia (English)
  • India (English)
  • New Zealand (English)
  • 中国
    • 简体中文Chinese
    • English
  • 日本Japanese (日本語)
  • 한국Korean (한국어)

Contact your local office

  • 영업 담당 문의
  • 평가판 신청

MathWorks

Accelerating the pace of engineering and science

MathWorks는 엔지니어와 과학자들을 위한 테크니컬 컴퓨팅 소프트웨어 분야의 선도적인 개발업체입니다.

활용 분야 …

제품 소개

  • MATLAB
  • Simulink
  • 학생용 소프트웨어
  • 하드웨어 지원
  • File Exchange

다운로드 및 구매

  • 다운로드
  • 평가판 신청
  • 영업 상담
  • 가격 및 라이선스
  • MathWorks 스토어

사용 방법

  • 문서
  • 튜토리얼
  • 예제
  • 비디오 및 웨비나
  • 교육

지원

  • 설치 도움말
  • MATLAB Answers
  • 컨설팅
  • 라이선스 센터
  • 지원 문의

회사 정보

  • 채용
  • 뉴스 룸
  • 사회적 미션
  • 고객 사례
  • 회사 정보
  • Select a Web Site United States
  • 신뢰 센터
  • 등록 상표
  • 정보 취급 방침
  • 불법 복제 방지
  • 애플리케이션 상태
  • 매스웍스코리아 유한회사
  • 주소: 서울시 강남구 삼성동 테헤란로 521 파르나스타워 14층
  • 전화번호: 02-6006-5100
  • 대표자 : 이종민
  • 사업자 등록번호 : 120-86-60062

© 1994-2022 The MathWorks, Inc.

  • Naver
  • Facebook
  • Twitter
  • YouTube
  • LinkedIn
  • RSS

대화에 참여하기