How can I make the following plot?

이전 댓글 표시
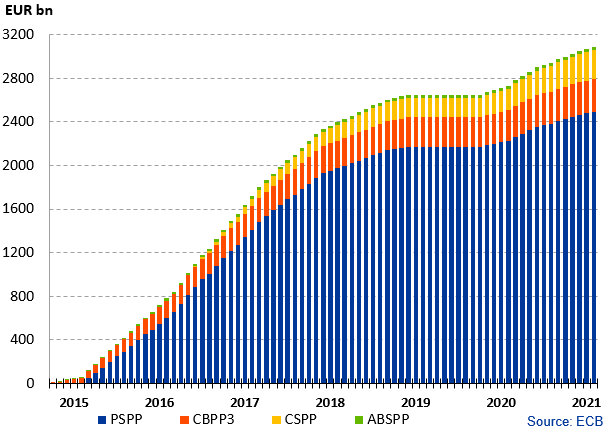
Suppose I have time series for PSPP, CBPP3, CSPP, ABSPP. How would you make a plot that looks like the one above?
채택된 답변

Adam Danz
2020년 4월 15일
0 개 추천
Use bar(x, y, 'stacked') where x are datetime values (or integers for years) and y is a matrix where each row defines the stacked values for 1 bar. There's a example of a stacked bar chart in within the link.
추가 답변 (1개)

David Hill
2020년 4월 15일
Assuming your inputs are a row vectors of the same size.
y=[PSPP',CBPP3',CSPP3',ABSPP'];
bar(y,'stacked');
카테고리
도움말 센터 및 File Exchange에서 Bar Plots에 대해 자세히 알아보기
제품
Community Treasure Hunt
Find the treasures in MATLAB Central and discover how the community can help you!
Start Hunting!
Translated by 

