viewAnomalyDetectionResults
Description
Add-On Required: This feature requires the Automated Visual Inspection Library for Computer Vision Toolbox add-on.
viewAnomalyDetectionResults(
displays the anomaly detection results for a set of test images detector,I,gtLabels,scores,anomalyLabels)I. The
function displays the predicted scores against the ground truth
gtLabels. anomalyLabels indicates which class
labels in gtLabels belong to the anomaly (positive) class
Note
This functionality requires Deep Learning Toolbox™ and the Automated Visual Inspection Library for Computer Vision Toolbox™. You can install the Automated Visual Inspection Library for Computer Vision Toolbox from Add-On Explorer. For more information about installing add-ons, see Get and Manage Add-Ons.
Examples
Load test images and corresponding labels, then create a datastore that reads the test data. The data set consists of grayscale images of handwritten digits 0–9.
[Xtest,gtLabels] = digitTest4DArrayData;
dsTest = arrayDatastore(Xtest,IterationDimension=4);
Load a pretrained FCDD anomaly detector. This detector has been trained to classify the digit 8 as normal and all other digits as anomalies. Therefore, specify the set of positive labels as the set of digits between 0 and 9, excluding 8.
load("digit8AnomalyDetector.mat")
anomalyLabels = setdiff(string(0:9),"8");
Predict anomaly scores for each test image using the FCDD anomaly detector.
predScores = predict(detector,dsTest);
View the anomaly detection results.
viewAnomalyDetectionResults(detector,dsTest,gtLabels,predScores,anomalyLabels);

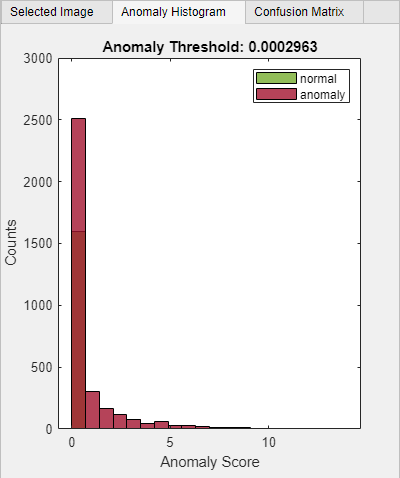
Select the Anomaly Histogram tab to view the Anomaly Score vs. Counts histogram plot. Note the Anomaly Threshold of 0.0002963 on the anomaly histogram plot. Above this threshold, the detector classifies the test image as an anomaly.
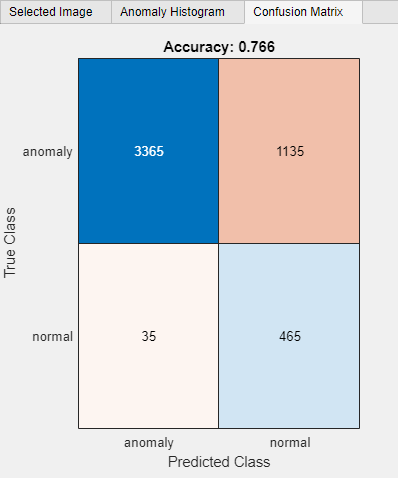
Select the Confusion Matrix tab to view the performance of the trained anomaly detector. You can also use this matrix to set predicted and ground truth filters. The accuracy of 0.766 represents the ratio of correctly classified images to the total number of images in the data set.
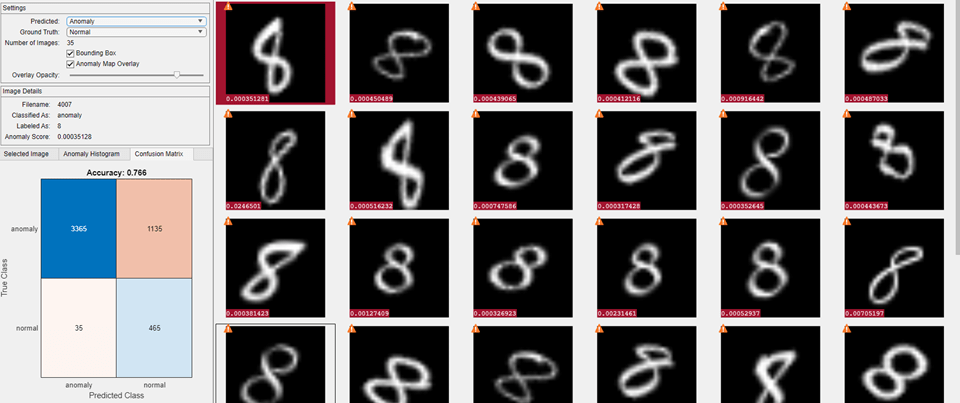
Analyze the false positive images by setting the Predicted parameter to Anomaly and the Ground Truth parameter to Normal in the Settings pane. On each thumbnail of false positive images, the score appears against a red background because of the positive classification. The icon in the top left corner of the thumbnail is a yellow triangle with a white exclamation mark, which indicates the image is misclassified.
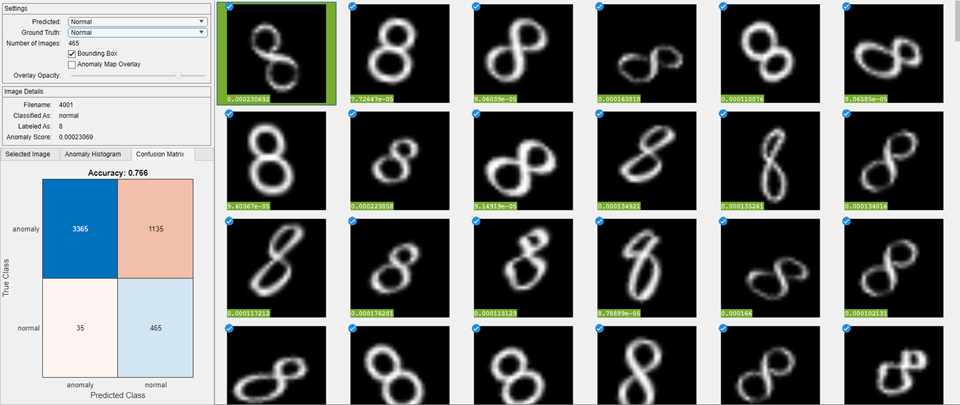
Analyze the true negative images by setting the Predicted parameter to Normal and the Ground Truth parameter to Normal. On each thumbnail of true negative images, the score appears against a green background because of the negative classification. The icon in the top left corner of the thumbnail is a blue circle with a white checkmark, which indicates the image is correctly classified.
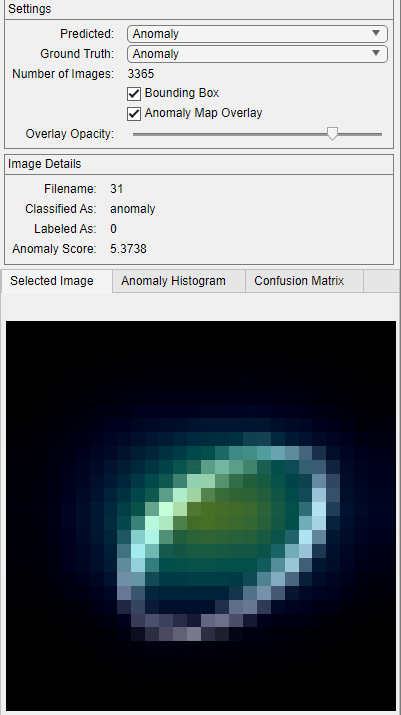
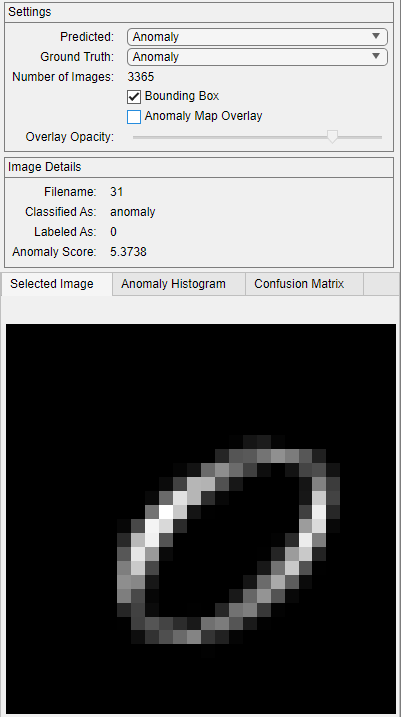
Analyze the true positive images by setting the Predicted parameter to Anomaly and the Ground Truth parameter to Anomaly. Select the image with the filename 31. The anomaly map overlay displays the anomaly heatmap over the image. Clear Anomaly Map Overlay in the Settings pane and observe the difference in the Selected Image tab.