selectUniform
Select uniformly distributed subset of point features
Description
Examples
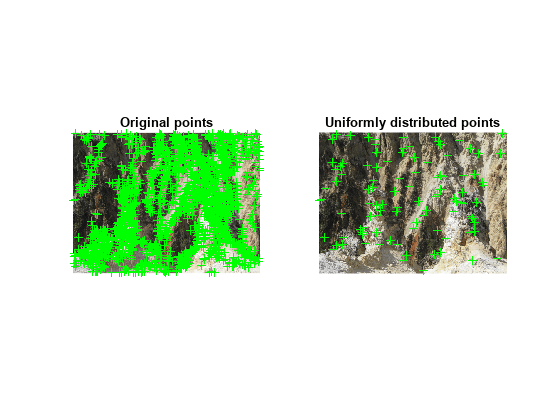
Read an image.
im = imread("yellowstone_left.png");Detect and display KAZE features.
points1 = detectKAZEFeatures(im2gray(im))
points1 =
  6713×1 KAZEPoints array with properties:

       Location: [6713×2 single]
         Metric: [6713×1 single]
          Count: 6713
          Scale: [6713×1 single]
    Orientation: [6713×1 single]
subplot(1,2,1)
imshow(im)
hold on
plot(points1)
hold off
title("Original Points")
Select a uniformly distributed subset of points.
numPoints = 100;
points2 = selectUniform(points1,numPoints,size(im))
points2 =
  100×1 KAZEPoints array with properties:

       Location: [100×2 single]
         Metric: [100×1 single]
          Count: 100
          Scale: [100×1 single]
    Orientation: [100×1 single]
subplot(1,2,2)
imshow(im)
hold on
plot(points2)
hold off
title("Uniformly Distributed Points")

Load an image.
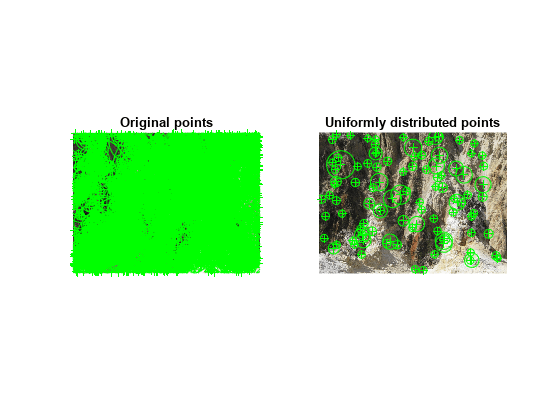
im = imread("yellowstone_left.png");Detect many corners by reducing the quality threshold.
points1 = detectHarrisFeatures(im2gray(im),MinQuality=0.05);
Plot image with detected corners.
subplot(1,2,1);
imshow(im);
hold on
plot(points1);
hold off
title("Original points");
Select a uniformly distributed subset of points.
numPoints = 100;
points2 = selectUniform(points1,numPoints,size(im));
Plot images showing original and subset of points.
subplot(1, 2, 2);
imshow(im);
hold on
plot(points2);
hold off
title("Uniformly distributed points");

Load an image into the workspace.
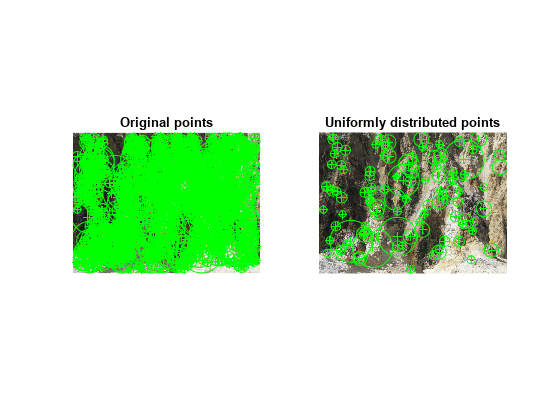
im = imread("yellowstone_left.png");Detect many corners by reducing the quality threshold.
points1 = detectBRISKFeatures(im2gray(im),MinQuality=0.05);
Plot image with detected corners.
subplot(1,2,1);
imshow(im);
hold on
plot(points1);
hold off
title("Original points");
Select a uniformly distributed subset of points.
numPoints = 100;
points2 = selectUniform(points1,numPoints,size(im));
Plot images showing original and subset of points.
subplot(1, 2, 2);
imshow(im);
hold on
plot(points2);
hold off
title("Uniformly distributed points");

Load an image.
im = imread("yellowstone_left.png");Detect and display SURF features.
points1 = detectSURFFeatures(im2gray(im));
subplot(1,2,1);
imshow(im);
hold on
plot(points1);
hold off
title("Original points");
Select a uniformly distributed subset of points.
numPoints = 100;
points2 = selectUniform(points1,numPoints,size(im));
Plot images showing original and subset of points.
subplot(1, 2, 2);
imshow(im);
hold on
plot(points2);
hold off
title("Uniformly distributed points");

Input Arguments
Points object,specified as an M-by-2 matrix of M number of [x y] coordinates, or as one of the point feature objects described in Point Feature Types. The object contains information about the point features detected in the input image. To obtain points, use the appropriate detect function that pairs with the point feature type.
Number of uniformly distributed points to select, specified as an integer.
Size of image, specified as a 2-element vector for grayscale images or a 3-element vector for truecolor images.
Output Arguments
Uniformly distributed points, returned as a points feature object.
Version History
Introduced in R2012a
MATLAB Command
You clicked a link that corresponds to this MATLAB command:
Run the command by entering it in the MATLAB Command Window. Web browsers do not support MATLAB commands.
웹사이트 선택
번역된 콘텐츠를 보고 지역별 이벤트와 혜택을 살펴보려면 웹사이트를 선택하십시오. 현재 계신 지역에 따라 다음 웹사이트를 권장합니다:
또한 다음 목록에서 웹사이트를 선택하실 수도 있습니다.
사이트 성능 최적화 방법
최고의 사이트 성능을 위해 중국 사이트(중국어 또는 영어)를 선택하십시오. 현재 계신 지역에서는 다른 국가의 MathWorks 사이트 방문이 최적화되지 않았습니다.
미주
- América Latina (Español)
- Canada (English)
- United States (English)
유럽
- Belgium (English)
- Denmark (English)
- Deutschland (Deutsch)
- España (Español)
- Finland (English)
- France (Français)
- Ireland (English)
- Italia (Italiano)
- Luxembourg (English)
- Netherlands (English)
- Norway (English)
- Österreich (Deutsch)
- Portugal (English)
- Sweden (English)
- Switzerland
- United Kingdom (English)