2-D Histogram
Generate histogram from input
Libraries:
Computer Vision Toolbox /
Statistics
Description
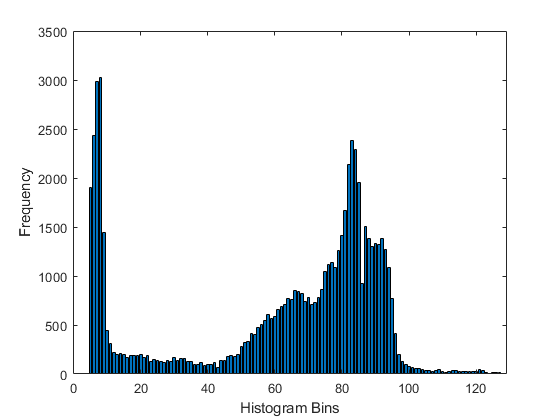
The 2-D Histogram block computes the frequencies of the elements in the input image. The block calculates the histogram values for either the entire input or for each column of the input image. It sorts all the of input values into bins according to their pixel values. The histogram value for a given bin represents the frequency of the input values bracketed by that bin. The block is also capable of computing a running histogram across a sequence of inputs. The block is also capable of computing a running histogram across a sequence of inputs.
Examples
Ports
Input
Output
Parameters
Block Characteristics
Data Types |
|
Multidimensional Signals |
|
Variable-Size Signals |
|
Algorithms
The histogram bins have equal width of:
where
BM — Represents the upper boundary of the highest-valued bin.
Bm — Represents the lower boundary of the lowest-valued bin.
n — Represents the number of bins.
The centers are located at:
For input values that fall between two bins, the block places them in the lower-valued bin. For input values greater than the upper limit of the histogram or less than the lower limit of the histogram, the block places them in the highest-valued or lowest-valued bin, respectively.
Extended Capabilities
Version History
Introduced before R2006a


