Generate Image Histogram
This example shows how to generate the histogram of an image using 2-D Histogram block. The model outputs a bar plot that shows the frequency of occurrence for pixels values in the input image.
Read an input image to the MATLAB® workspace.
I = imread('cameraman.tif');
Find the maximum intensity value in the input image.
maxI = max(I(:));
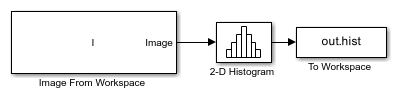
Open the Simulink® model. The model reads the image stored in variable I from the MATLAB workspace. The Upper limit of histogram parameter of the 2-D Histogram block is set to the maximum value of the intensity image. The Number of Bins parameter of the 2-D Histogram block is set to 128 and the histogram is computed for the entire input.
modelname = 'ex_blkhistogram.slx';
open_system(modelname);
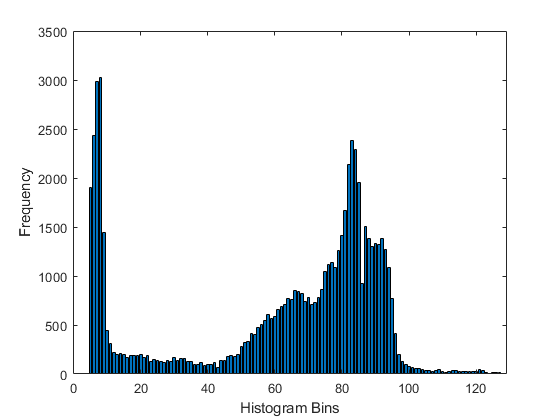
The model outputs a time series that specifies the frequency of occurrence of pixels within each bin. Export the histogram values to MATLAB workspace and plot the histogram.
out = sim(modelname);
bar(out.hist.data)
xlabel('Histogram Bins')
ylabel('Frequency')