이 번역 페이지는 최신 내용을 담고 있지 않습니다. 최신 내용을 영문으로 보려면 여기를 클릭하십시오.
상자를 사용하여 차트 객체 그룹화하기
상자는 상태, 함수, 데이터와 같은 객체를 차트에서 구성하는 데 사용할 수 있는 네임스페이스를 정의하는 그래픽 객체입니다. 상자를 사용하면 특정 작업을 수행하기 위해 차트에서 어떤 상태 또는 함수가 함께 작동하는지 한눈에 알아볼 수 있습니다.
둥근 코너를 갖는 상태와 구별되도록 상자의 코너는 직각입니다. MATLAB®의 독립 실행형 Stateflow® 차트에서는 상자가 지원되지 않습니다.
참고
Stateflow 차트에 메모를 추가하려면 상자 대신 주석을 사용하십시오. 자세한 내용은 차트에서 설명 주석 추가하기 항목을 참조하십시오.
이 차트에서 상자 Heater는 관련 상태인 Off와 On을 하나로 그룹화합니다.
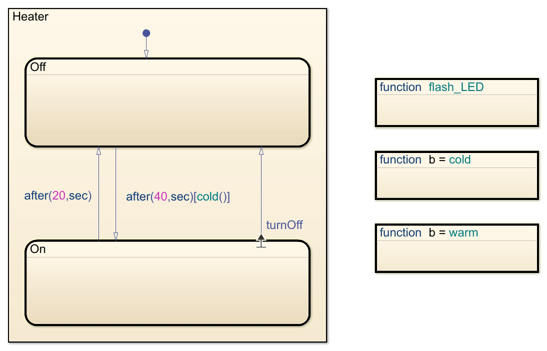
이 예제에 대한 자세한 내용은 뱅뱅 온도 제어 시스템 모델링하기 항목을 참조하십시오.
Stateflow 상자의 의미 체계
상자 내 그래픽 객체의 계층 구조
상자는 Stateflow 차트에 계층 구조 수준을 추가합니다. 상자 외부에서 상자가 부모로 지정된 함수 또는 상태를 참조할 경우, 경로에 상자 이름을 포함해야 합니다. 상자를 사용하여 함수 그룹화하기 항목을 참조하십시오.
상자 사용에 대한 지침
상자를 사용하는 경우:
상자 외부 위치에서 상자가 부모로 지정된 함수 또는 상태를 참조하기 위해 점 표기법을 사용하는 경우, 경로에 상자 이름을 포함합니다.
상자 내의 모든 요소가 동일한 데이터를 공유하도록 상자에 데이터를 추가할 수 있습니다.
상자와 그 내용을 단일 그래픽 요소로 그룹화할 수 있습니다. 상태 그룹화하기 항목을 참조하십시오.
상자를 서브차트로 변환하여 상자의 요소를 숨길 수 있습니다. Encapsulate Modal Logic by Using Subcharts 항목을 참조하십시오.
상자에 대해
entry동작,during동작,exit동작과 같은 동작문을 정의할 수 없습니다.상자로의 천이 또는 상자로부터의 천이를 정의할 수 없습니다. 그러나 상자 내부에 있는 상태로의 천이 또는 상태로부터의 천이는 정의할 수 있습니다.
상자 그리기 및 편집하기
상자 만들기
객체 팔레트의 상자 아이콘을 사용하여 차트에 상자를 만듭니다.
객체 팔레트에서 상자 툴
 을 클릭합니다.
차트 캔버스에서 새 상자의 위치를 클릭합니다. 이름을 추가할 수 있는 커서와 함께 새 상자가 나타납니다.
상자 이름을 입력한 다음 상자 외부를 클릭합니다.
상자 삭제하기
상자를 삭제하려면 상자를 클릭하고 Delete 키를 누릅니다.
상자 사용 예제
상자를 사용하여 함수 그룹화하기
이 차트는 2개의 MATLAB 함수를 그룹화하는 Status라는 상자를 보여줍니다.

차트는 다음 순서로 실행됩니다.
상태
Cold가 먼저 활성화됩니다.진입 시 상태
Cold는 함수Status.msgCold를 호출합니다.이 함수는 온도가 차갑다는 상태 메시지를 표시합니다.
참고
MATLAB 함수가 상자 안에 있으므로 함수 호출 경로는 상자 이름
Status를 포함해야 합니다. 이 접두사를 생략하면 오류 메시지가 표시됩니다.입력 데이터
temp의 값이 80을 초과할 경우 상태Warm으로의 천이가 발생합니다.진입 시 상태
Warm은 함수Status.msgWarm을 호출합니다.이 함수는 온도가 따뜻하다는 상태 메시지를 표시합니다.
입력 데이터
temp의 값이 60 미만으로 떨어질 경우 상태Cold로의 천이가 발생합니다.시뮬레이션이 끝날 때까지 2~5단계를 반복합니다.
상자를 사용하여 상태 그룹화하기
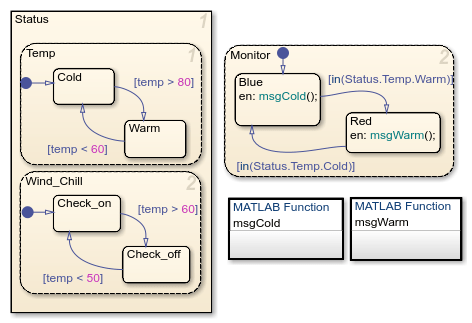
이 차트는 관련된 상태를 그룹화하는 Status라는 이름의 상자를 보여줍니다.
이 차트의 경우:
상태
Temp와 상태Wind_Chill이 순서대로 웨이크업 상태가 됩니다. 그런 다음 상태Monitor가 웨이크업 상태가 됩니다.활성화 순서가 이렇게 되는 이유는
Temp와Wind_Chill이 우선순위가 1인 상자 내에 있기 때문입니다. 상자를 제거하면 활성화 순서는 상태가 만들어진 순서에 따라Temp,Monitor,Wind_Chill순서로 변경됩니다. 자세한 내용은 병렬 상태 순서 관리 항목을 참조하십시오.
입력 데이터
temp에 따라 병렬 상태Status.Temp와Status.Wind_Chill에서 하위 상태 간에 천이가 발생합니다.Status.Temp.Cold에서Status.Temp.Warm으로의 천이가 발생하는 경우, 천이 조건in(Status.Temp.Warm)은 true가 됩니다.Status.Temp.Warm에서Status.Temp.Cold로의 천이가 발생하는 경우, 천이 조건in(Status.Temp.Cold)는 true가 됩니다.하위 상태
Status.Temp.Cold와Status.Temp.Warm이 상자 안에 있으므로in연산자의 인수에 상자 이름Status가 포함되어야 합니다. 이 접두사를 생략하면 오류 메시지가 표시됩니다.in연산자에 대한 자세한 내용은 Check State Activity by Using the in Operator 항목을 참조하십시오.