Encapsulate Modal Logic by Using Subcharts
A subchart is a graphical object that can contain anything that a top-level chart can, including other subcharts. A subchart, or a subcharted state, is a superstate of the states that it contains. You can nest subcharts to any level in your chart design.
Using subcharts, you can reduce a complex chart to a set of simpler, hierarchically organized units. This design makes the chart easier to understand and maintain, without changing the chart behavior. Subchart boundaries do not apply during simulation and code generation.
The subchart appears as a block with its name in the block center. However, you can define actions and default transitions for subcharts just as you can for superstates. You can also create transitions to and from subcharts just as you can create transitions to and from superstates. You can create transitions between states residing outside a subchart and any state within a subchart. The term supertransition refers to a transition that crosses subchart boundaries in this way. See Move Between Levels of Hierarchy by Using Supertransitions for more information.
Subcharts define a containment hierarchy within a top-level chart. A subchart or top-level chart is the parent of the states it contains at the first level and an ancestor of all the subcharts contained by its children and their descendants at lower levels.
Some subcharts can become atomic units if they meet certain modeling requirements. For more information, see Restrictions for Converting to Atomic Subcharts.
Create a Subchart
You create a subchart by converting an existing state, box, or graphical function into a subchart.
To convert a state, box, or graphical function to a subchart, right-click the object and select Group & Subchart > Subchart. To revert the subchart to its original form, right-click the subchart and select Group & Subchart > Subchart again.
When you convert an object to a subchart, the subchart retains the attributes of
the object. For example, if an object has the name On, the
subchart is also named On.
Convert a State to a Subchart
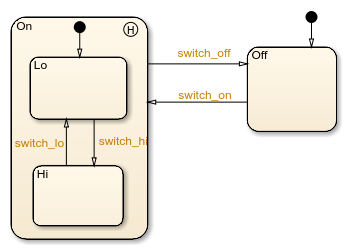
Suppose that you have the following chart:
To convert the
Onstate to a subchart, right-click the state and select Group & Subchart > Subchart.Confirm that the
Onstate now appears as a subchart.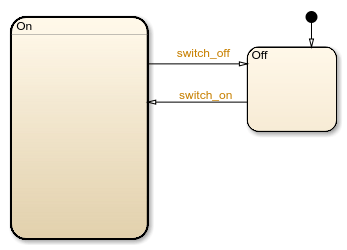
Manipulate Subcharts as Objects
Subcharts also act as individual objects. You can move, copy, cut, paste, relabel, and resize subcharts as you would states and boxes. You can also draw transitions to and from a subchart and any other state or subchart at the same or different levels in the chart hierarchy (see Move Between Levels of Hierarchy by Using Supertransitions).
Open a Subchart
Opening a subchart allows you to view and change its contents. To open a subchart, do one of the following:
Double-click anywhere in the box that represents the subchart.
Select the box representing the subchart and press the Enter key.
Edit a Subchart
After you open a subchart (see Open a Subchart), you can perform any editing operation on its contents that you can perform on a top-level chart. This means that you can create, copy, paste, cut, relabel, and resize the states, transitions, and subcharts in a subchart. You can also group states, boxes, and graphical functions inside subcharts.
You can also cut and paste objects between different levels in your chart. For example, to copy objects from a top-level chart to one of its subcharts, first open the top-level chart and copy the objects. Then open the subchart and paste the objects into the subchart.
Transitions from outside subcharts to states or junctions inside subcharts are called supertransitions. You create supertransitions differently than you do ordinary transitions. See Move Between Levels of Hierarchy by Using Supertransitions for information on creating supertransitions.
Navigate Subcharts
The Stateflow® Editor toolbar contains a set of buttons for navigating the subchart hierarchy of a chart.
Note
You can also use the Escape key to navigate up to the parent object for a subcharted state, box, or function.