Understand Simulink Model Comparison Changes
Go through the comparison report to explore the differences in your Simulink® model files. If you have not yet run a comparison analysis, see Select Models to Compare.
The comparison report displays only differences in the models. To step through the differences, use the Next and Previous buttons in the Navigate section of Comparison toolstrip. Alternatively, use the up and down arrows on your keyboard to navigate the report.
The Comparison Tool shows the first change when the report opens. The selected item appears in a box. If the selected item has a match, the box appears in both the left and right trees.
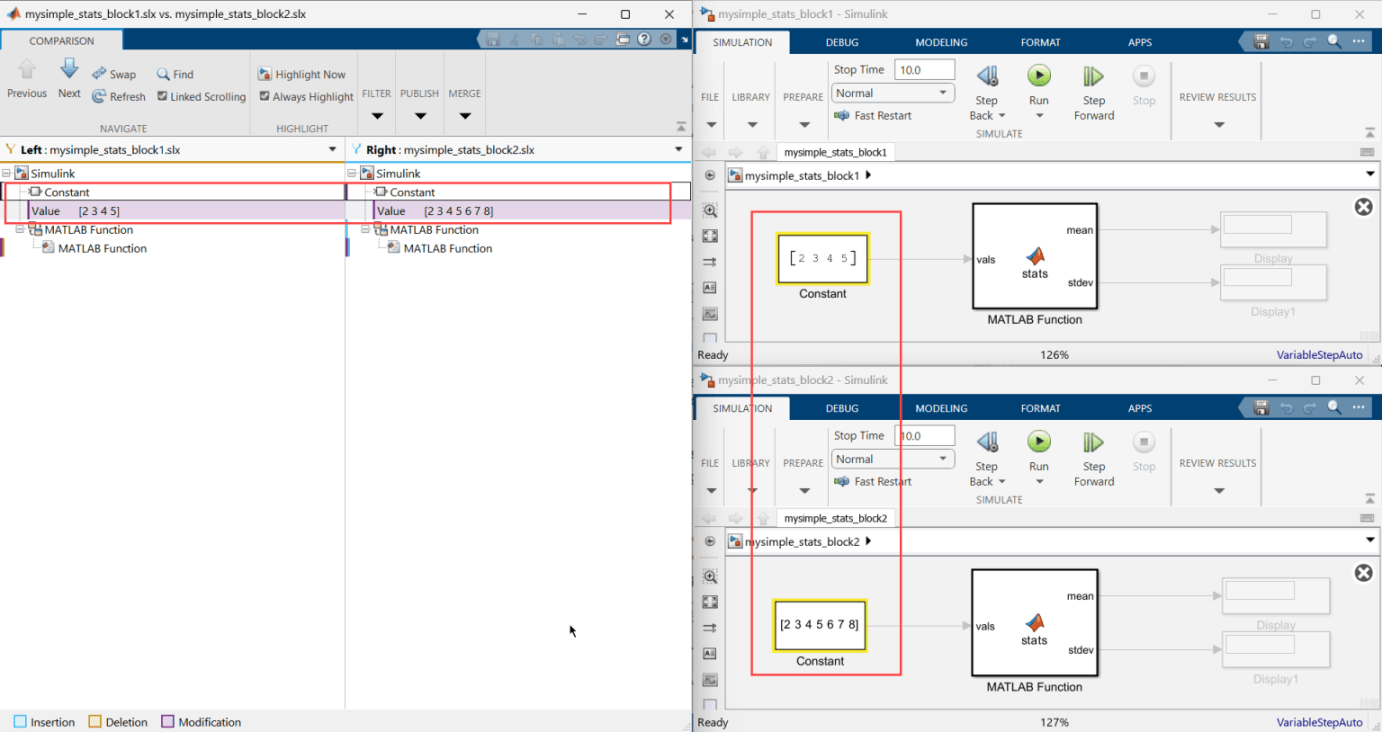
In this example report, the tool selects the Constant node and shows the details in a pane on the bottom of the report. In the details pane, the modified Value is colored in purple.

Tip
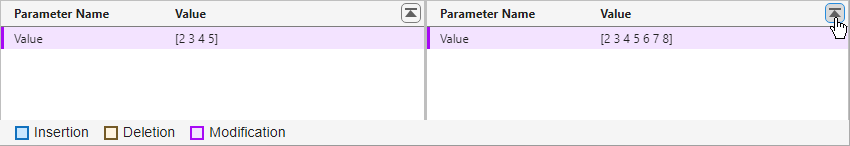
You can reposition the details pane beneath the corresponding node in the report by clicking the arrow located at the top corner of the pane.
By default, selecting an item in the model comparison report opens the original model and highlights the corresponding change item in the editor. If you select a Configuration Parameter item, the tool also opens the corresponding pane in the Configuration Parameters dialog box. For more information, see Open and Highlight Changes in Simulink Editor.
To investigate the next change in the report, click Next.
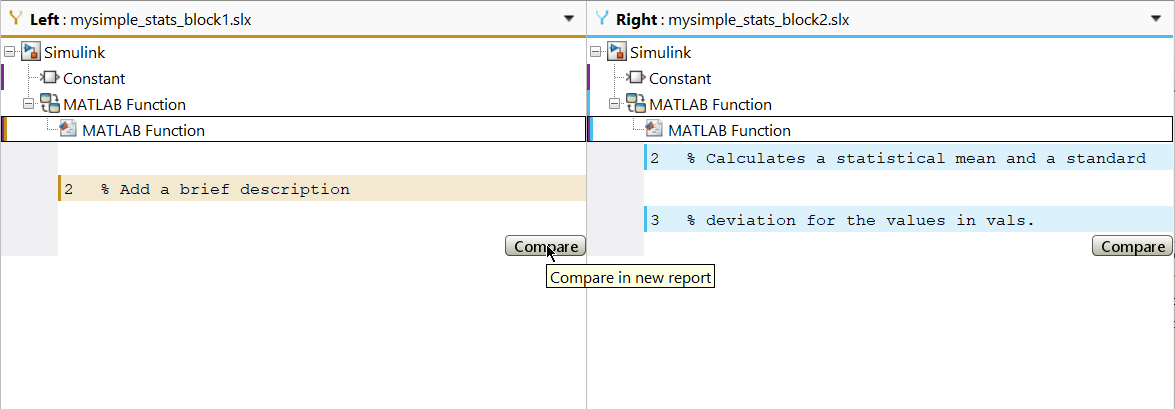
In this example report, the tool selects the MATLAB Function node. The details pane shows the modified Description in purple, and the added Script line in blue.

If additional comparisons are available for particular nodes, you see a Compare button in the details pane to open a sub-comparison report for the selected change.
After stepping through all changes, the tool disables the Next button.
If you click an item in the report, the Next and Previous buttons step through changes from the point you selected.
Tip
Use one of these methods to simplify the report and focus on critical changes.
For complex changes, use the model highlight capabilities to show and highlight model changes in the Simulink Editor. Highlighting changes helps you identify important differences quickly and simplifies the interpretation process. For more information, see Open and Highlight Changes in Simulink Editor.
For large model comparison reports, use filtering to reduce the report size and focus on critical changes in the report. By default, the report hides all nonfunctional changes. For information on how to create custom filters and apply built-in filters, see Simplify Comparison Report Using Filters.
Open and Highlight Changes in Simulink Editor
To quickly identify changes in your Simulink models, enable highlighting in the Comparison Tool. In the Comparison toolstrip, to always highlight changes in the Simulink Editor, enable Always Highlight.
When you select an item in the report, the Comparison Tool opens the models in the editor and highlights changes in yellow. If you select a configuration parameter item, the tool also displays the corresponding pane in the Configuration Parameters dialog box.
Alternatively, you can highlight changes only when needed. In the Comparison toolstrip, clear Always Highlight and click Highlight Now to highlight the selection in the Simulink Editor.
By default, the Comparison Tool opens the two models you compare to the right of the comparison report, with the model in the left side of the report on top and the model in the right side of the report below. If you move or resize the models, the tool remembers your window positions for subsequent model highlighting operations.
To remember Simulink, Stateflow®, and truth table window positions across MATLAB® sessions, enter this command.
slxmlcomp.storeWindowPositions
To restore window positions to the defaults, enter:
slxmlcomp.clearWindowPositions
Simplify Comparison Report Using Filters
To simplify the comparison report and focus on critical changes, use filters. You can filter based on specific block types, specific changes, or other criteria, such as nonfunctional changes.
The comparison tool offers quick filters for nonfunctional changes, block parameters and model elements. By default, the report hides all nonfunctional including block defaults changes. For more information about quick filters, see Comparison Tool.
You can also create and export custom filters to share with others.
In this example, suppose you want to only inspect changes to Constant blocks.
In the Comparison toolstrip, in the Filter section, click Filter.
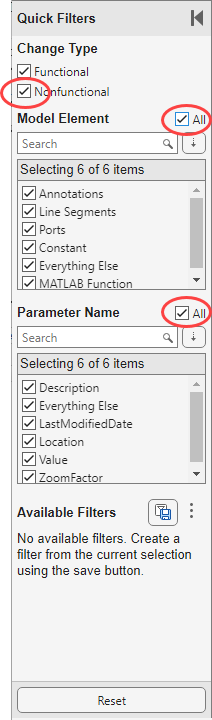
In the Quick Filters pane on the left, in the Model Element section, clear the All checkbox. Then, select the Constant checkbox.
The Comparison Tool updates the report automatically.

You can save the current selection into a custom filter. You can also export the filters to share with other users. For more information about quick filters, see Filter Comparison Report Using Quick Filters.
To show all changes in the report including nonfunctional changes, in the Quick Filters pane, select the Nonfunctional checkbox and the All check boxes in the Model Element and Parameter Name sections.