plotxy
Plot two series against each other
Description
fh = plotxy(x,y)y along the
y-axis, with values of the simulation series
x along the x-axis.
fh is a cell array of handles to the resulting figures.
x and yare
simscape.logging.Series objects or homogeneous cell arrays of such
objects. All series must have the same time vectors. If x and
y are cell arrays, they must be of the same size, or one of them can
be a scalar.
Examples
Plot the motor torque series against its angular velocity series.
Open the Permanent Magnet DC Motor example model:
openExample('simscape/PermanentMagnetDCMotorExample')
This example model has data logging enabled for the whole model, with the
Workspace variable name parameter set to
simlog_PermanentMagnetDCMotor.
Simulate the model to log the simulation data:
sim('PermanentMagnetDCMotor');Plot the motor torque against its angular velocity:
simscape.logging.plotxy(simlog_PermanentMagnetDCMotor.DC_Motor.Rotational_Electromechanical_Converter.R.w.series,...
   simlog_PermanentMagnetDCMotor.DC_Motor.Inertia.t.series)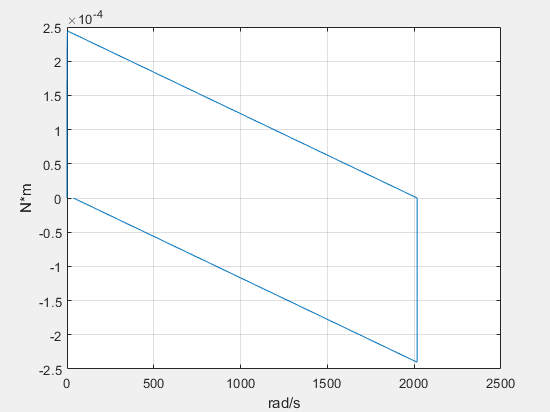
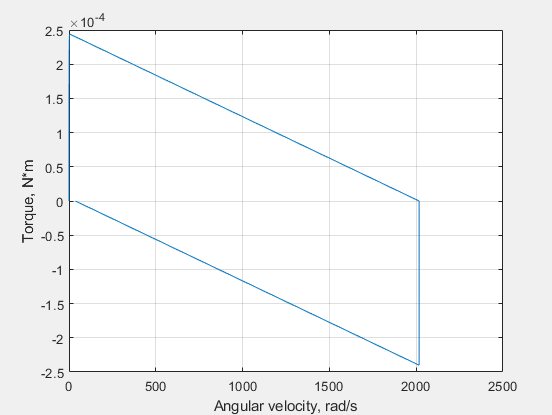
When you plot the series against each other, the default plot displays only the unit names along each axis. To add the axis names, use name-value pair arguments.
simscape.logging.plotxy(simlog_PermanentMagnetDCMotor.DC_Motor.Rotational_Electromechanical_Converter.R.w.series,...
   simlog_PermanentMagnetDCMotor.DC_Motor.Inertia.t.series,'xname','Angular velocity','yname','Torque')
Input Arguments
Name-Value Arguments
Output Arguments
Version History
Introduced in R2010b