plotModelParameters
Description
plotModelParameters( plots all
the parameters inside the circuitModel)ModelParametersTable property of the
ECM object, circuitModel.
Examples
This example shows how to plot the model parameters inside an
ECM object.
Open the DownloadBatteryData example and load the required HPPC
data obtained for a BAK 2.9 Ah battery cell at 25 °C. This data consists of a table with
three columns. The columns of the table refer to time, voltage, and current values,
respectively.
openExample("simscapebattery/DownloadBatteryDataExample")
load("testDataBAKcells/hppcDataBAKcell25degC.mat")
Store the HPPC data inside an HPPCTest object by using the hppcTest function. The HPPC data is a table,
so you must also specify each column name by using the TimeVariable,
VoltageVariable, and CurrentVariable arguments.
These names must match the names of the columns in the hppcData
table.
hppcExp = hppcTest(hppcData,...
    TimeVariable="time (s)",...
    VoltageVariable="voltage (V)",...
    CurrentVariable="current (A)");
Fit the HPPC data in the hppcExp object to a battery equivalent
circuit model (ECM). To fit the data and create an ECM object, use the
fitECM
function.
batteryEcm = fitECM(hppcExp);
Analyze the model parameters inside the batteryECM object by using
the ModelParameters property.
batteryEcm.ModelParameterTables
ans =
struct with fields:
ChargeOpenCircuitVoltage: [3.5098 3.5098 3.5098 3.5695 3.6224 3.6936 3.7905 3.8751 3.9674 4.0570 4.1158]
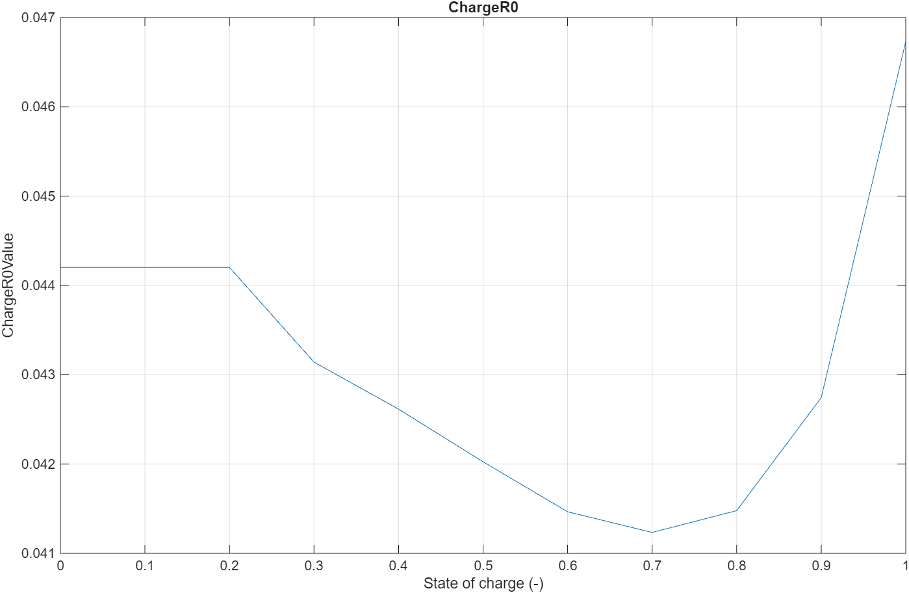
ChargeR0: [0.0442 0.0442 0.0442 0.0431 0.0426 0.0420 0.0415 0.0412 0.0415 0.0427 0.0467]
ChargeR1: [0.0112 0.0112 0.0112 0.0104 0.0105 0.0123 0.0132 0.0124 0.0121 0.0121 0.0150]
ChargeTau1: [13.5612 13.5612 13.5612 13.5502 13.5336 13.3463 13.1510 13.2508 13.2585 13.4524 12.6611]
ChargeC1: [1.2079e+03 1.2079e+03 1.2079e+03 1.2973e+03 1.2843e+03 1.0826e+03 993.6645 1.0672e+03 1.0918e+03 1.1137e+03 842.2532]
ChargeR2: [0.0140 0.0140 0.0140 0.0145 0.0144 0.0138 0.0140 0.0138 0.0139 0.0138 0.0137]
ChargeTau2: [104.3014 104.3014 104.3014 102.6275 102.9727 103.6730 101.2828 103.3495 104.4130 103.4471 102.1891]
ChargeC2: [7.4513e+03 7.4513e+03 7.4513e+03 7.0729e+03 7.1611e+03 7.4953e+03 7.2523e+03 7.4783e+03 7.4884e+03 7.4746e+03 7.4722e+03]
ChargeFitPc: [6.6661e-10 6.6661e-10 6.6661e-10 8.5981e-10 9.6784e-10 7.6042e-10 3.4343e-11 2.5804e-10 7.5818e-09 7.4191e-10 9.3651e-11]
DischargeOpenCircuitVoltage: [3.5507 3.5507 3.5507 3.6015 3.6500 3.7353 3.8460 3.9226 4.0132 4.0837 4.1745]
DischargeR0: [0.0423 0.0423 0.0423 0.0407 0.0399 0.0393 0.0389 0.0388 0.0388 0.0402 0.0428]
DischargeR1: [0.0096 0.0096 0.0096 0.0091 0.0089 0.0089 0.0096 0.0098 0.0090 0.0105 0.0120]
DischargeTau1: [12.7536 12.7536 12.7536 12.8370 12.5963 13.0530 12.8092 12.4682 12.4945 12.3932 12.4108]
DischargeC1: [1.3235e+03 1.3235e+03 1.3235e+03 1.4038e+03 1.4081e+03 1.4658e+03 1.3355e+03 1.2717e+03 1.3951e+03 1.1759e+03 1.0352e+03]
DischargeR2: [0.0133 0.0133 0.0133 0.0133 0.0135 0.0132 0.0133 0.0135 0.0135 0.0134 0.0132]
DischargeTau2: [111.5192 111.5192 111.5192 112.1673 112.9559 111.6426 111.9445 112.6992 114.3181 111.9695 109.5712]
DischargeC2: [8.3541e+03 8.3541e+03 8.3541e+03 8.4106e+03 8.3800e+03 8.4506e+03 8.4134e+03 8.3759e+03 8.4974e+03 8.3326e+03 8.2816e+03]
DischargeFitPc: [2.3846e-09 2.3846e-09 2.3846e-09 1.7385e-09 9.1796e-10 5.7450e-10 6.2766e-10 1.2186e-10 1.1128e-09 6.6898e-10 2.4574e-09]Plot the 2-D model parameters.
plotModelParameters(batteryEcm)


Input Arguments
Version History
Introduced in R2025a